Insights are hidden in your data just waiting to be discovered.
If you’ve got an inquisitive and playful mind,
Raven dashboards will help you conduct exploratory data analysis and convert enigmas into enlightenment.
Ooh this is cool!
-SVP, Consumer Insights
How can Raven dashboards help you?
- Hone in on key hypotheses and conclusions for custom projects or ongoing trackers
- Save time and money, and eliminate accidental errors arising from manual charting
- Unearth daily, weekly, monthly, and quarterly tracker trends in multiple waves of data
- Uncover local, national, and international differences
- Understand the unique perspectives of targeted demographic or psychographic consumer segments
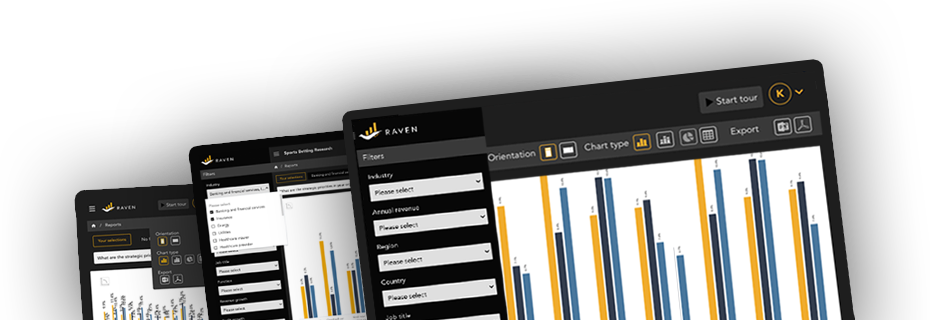
Interactive, user-guided exploration
- Choose from a variety of horizontal and vertical charts
- Create cross tabulations with any demographic or psychographic variable
- Use filters to hone in on specific segments
- Access detailed tables for every chart
- Both counts vs Percentages
- Swap Axis / Filter Data set points
- Present all question types
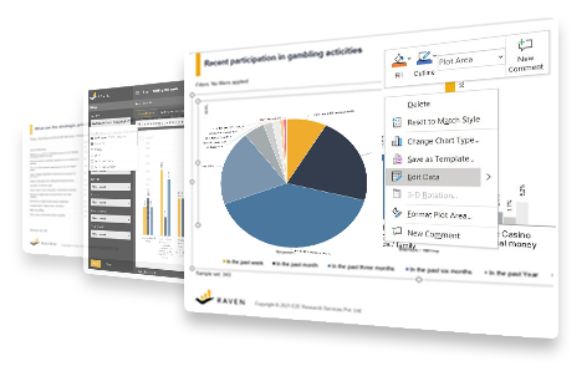
Easily export and customize your key results
- Editable PowerPoint tables and charts
- Export tables and charts to PDF Use filters to hone in on specific segments
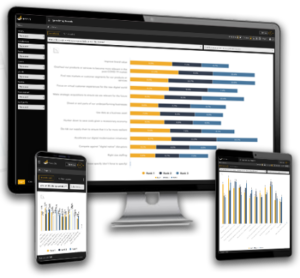
Compatible with all platforms & devices

Accommodates data from all common questionnaire scripting platforms including Confirmit, Qualtrics, Decipher, Sawtooth and more

Work in a wide range of current browsers including Chrome, Firefox, Safari, and IE 8.0 & above

Works on all desktop, portable, and personal devices
Built by researchers for
researchers
- Designed specifically for market, consumer, and social researchers
- Proprietary software brought to you by E2E Research, an ISO 27001 certified company

Ready to get started?
End-to-end data to dashboard in as little as 3 days.
Competitively priced for small and huge projects.
Testimonials
"I wanted to send you a personal email to congratulate you on the dashboard. We presented it to the clients and they were amazed by the tool, the style and the intuitivity."
- Director of Research, Mid-size market research company
"Oooohhhhhhh wow. That was SOOOOOOO cool! The visual information is a quick read once you get used to looking at it. Our clients better love this and be at least as impressed as I am. 😉 Thanks all who built this. CONGRATULATIONS TEAM!"
- Marketing company