What’s the first thing that comes to mind when you think of ravens?
.
For me, it’s how smart and inquisitive they are. They’re incredible problem solvers, always investigating the world around them and evaluating their options. Their intelligence has been thoroughly tested and well documented by nature experts around the world.
.
For example, this clip shows a raven that has learned to solve a complicated puzzle using sticks and stones. (BBC Earth, 4 minutes).
.. ..
.
Dashboards As Insight Tools
Just as ravens use tools to solve puzzles, researchers use data dashboards to solve puzzles. When we drop our data into dashboards, we manipulate the data, evaluate our hypotheses, and test and interpret outcomes. This process requires intelligence, cunning, and intense curiosity.
All this to say that the E2E Research team is excited to bring our new, proprietary Raven dashboard out of beta testing and into the limelight. Whether your focus is marketing, consumer, or social research, we know that Raven dashboards will help spark your curiosity so that you can convert enigmas into enlightenment and grow your brand.
..
Key Features of Raven Dashboards
Regardless of whether you’re a devoted data user or a hesitant data avoider, we’ve made sure that Raven is easy to use.
.
By Researchers, For Researchers
Our researchers, developers, and engineers have years of experience building highly customized, complex dashboards. We’ve learned exactly what features researchers and marketers need to unravel problems and get to the insight. And, it’s time for simple and small projects to benefit from dashboards too!
.
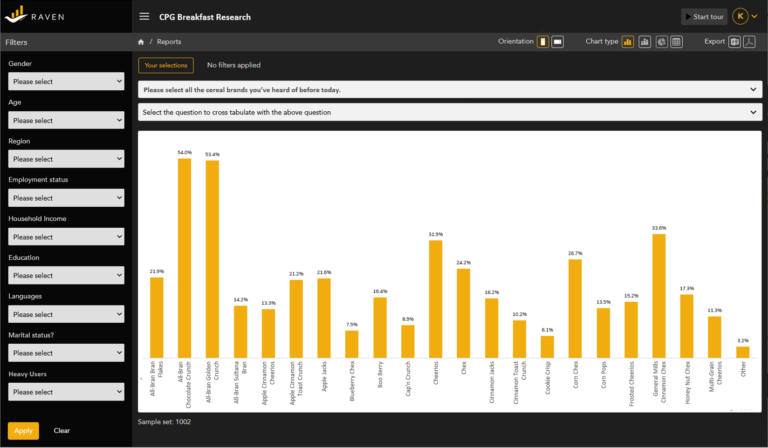
 Beautiful Charts and Tables
• A variety of charts and tables are immediately accessible from the main menu.
• Instantly switch your charts from horizontal to vertical orientation and back again to more clearly display labels or improve the readability of data.
• With the click of a button, instantly switch a chart into a detailed table with decimal places.
• Every data point is labeled and full details about that point are available on mouse-over.
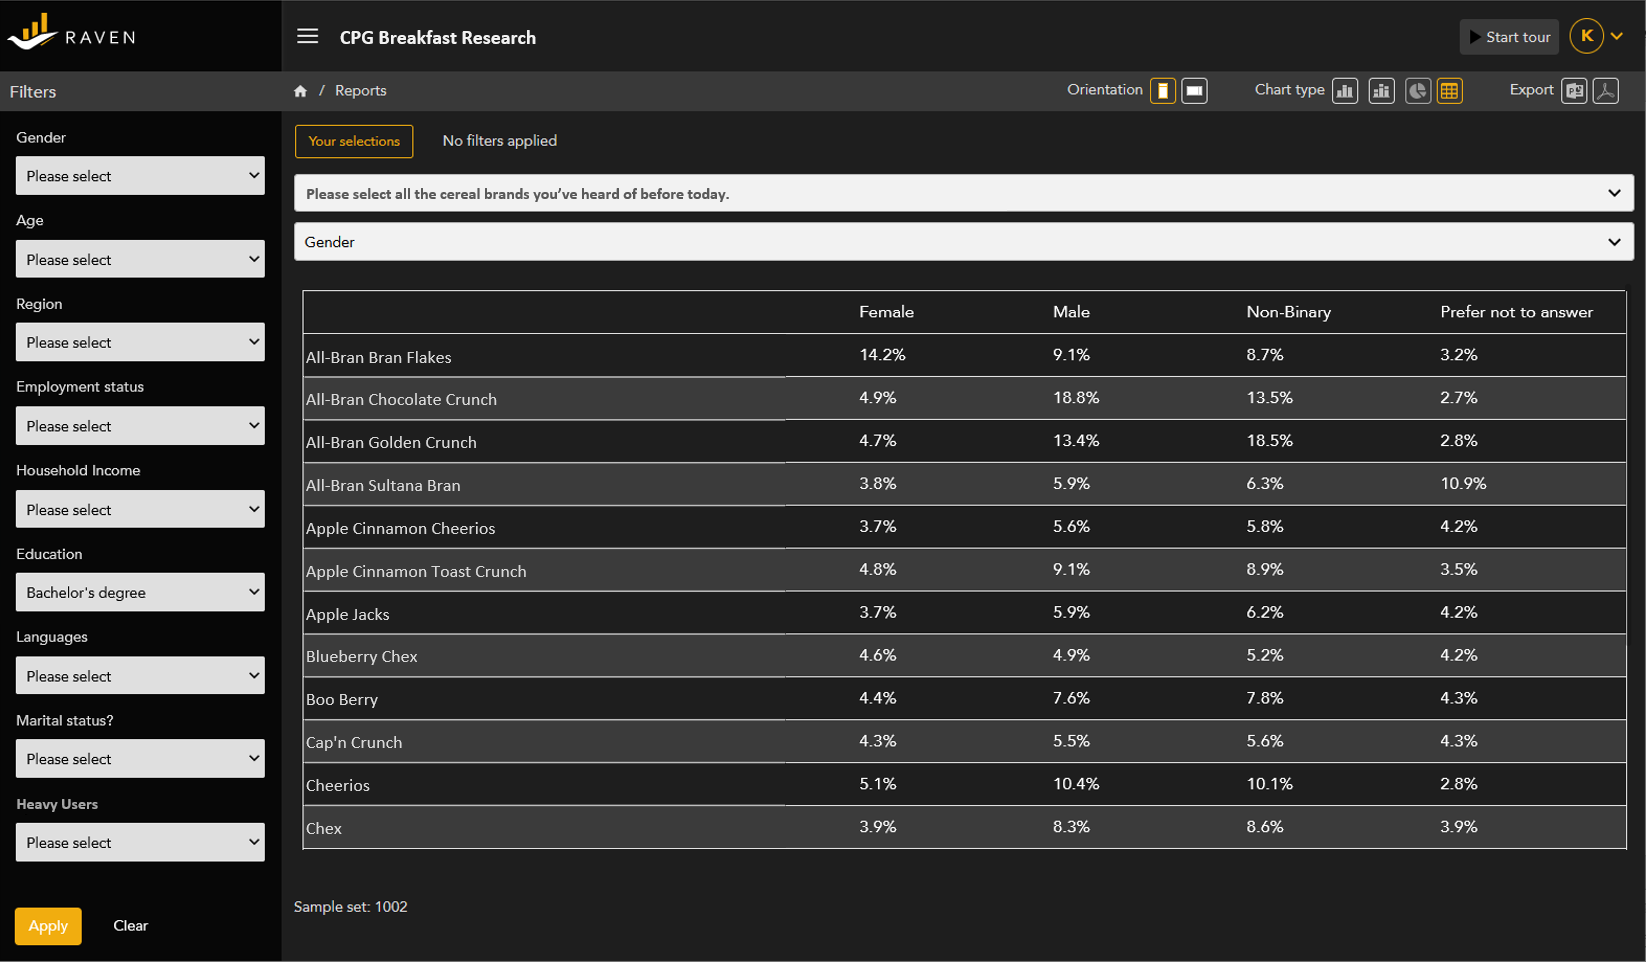 Insightful Crosstabs and Filtering
• Move beyond univariate analysis and evaluate differences among demographic and psychographic segments.
• Use crosstabs to look at interactions within multiple variables. Choose the key variable, and the cross-tab variable at the top of the chart/table.
• Use filtering to hone in on tight demographic or psychographic segments of consumers and customers. Select only the segment you are interested in using the variables in the left-hand menu. Filter from within the legend.
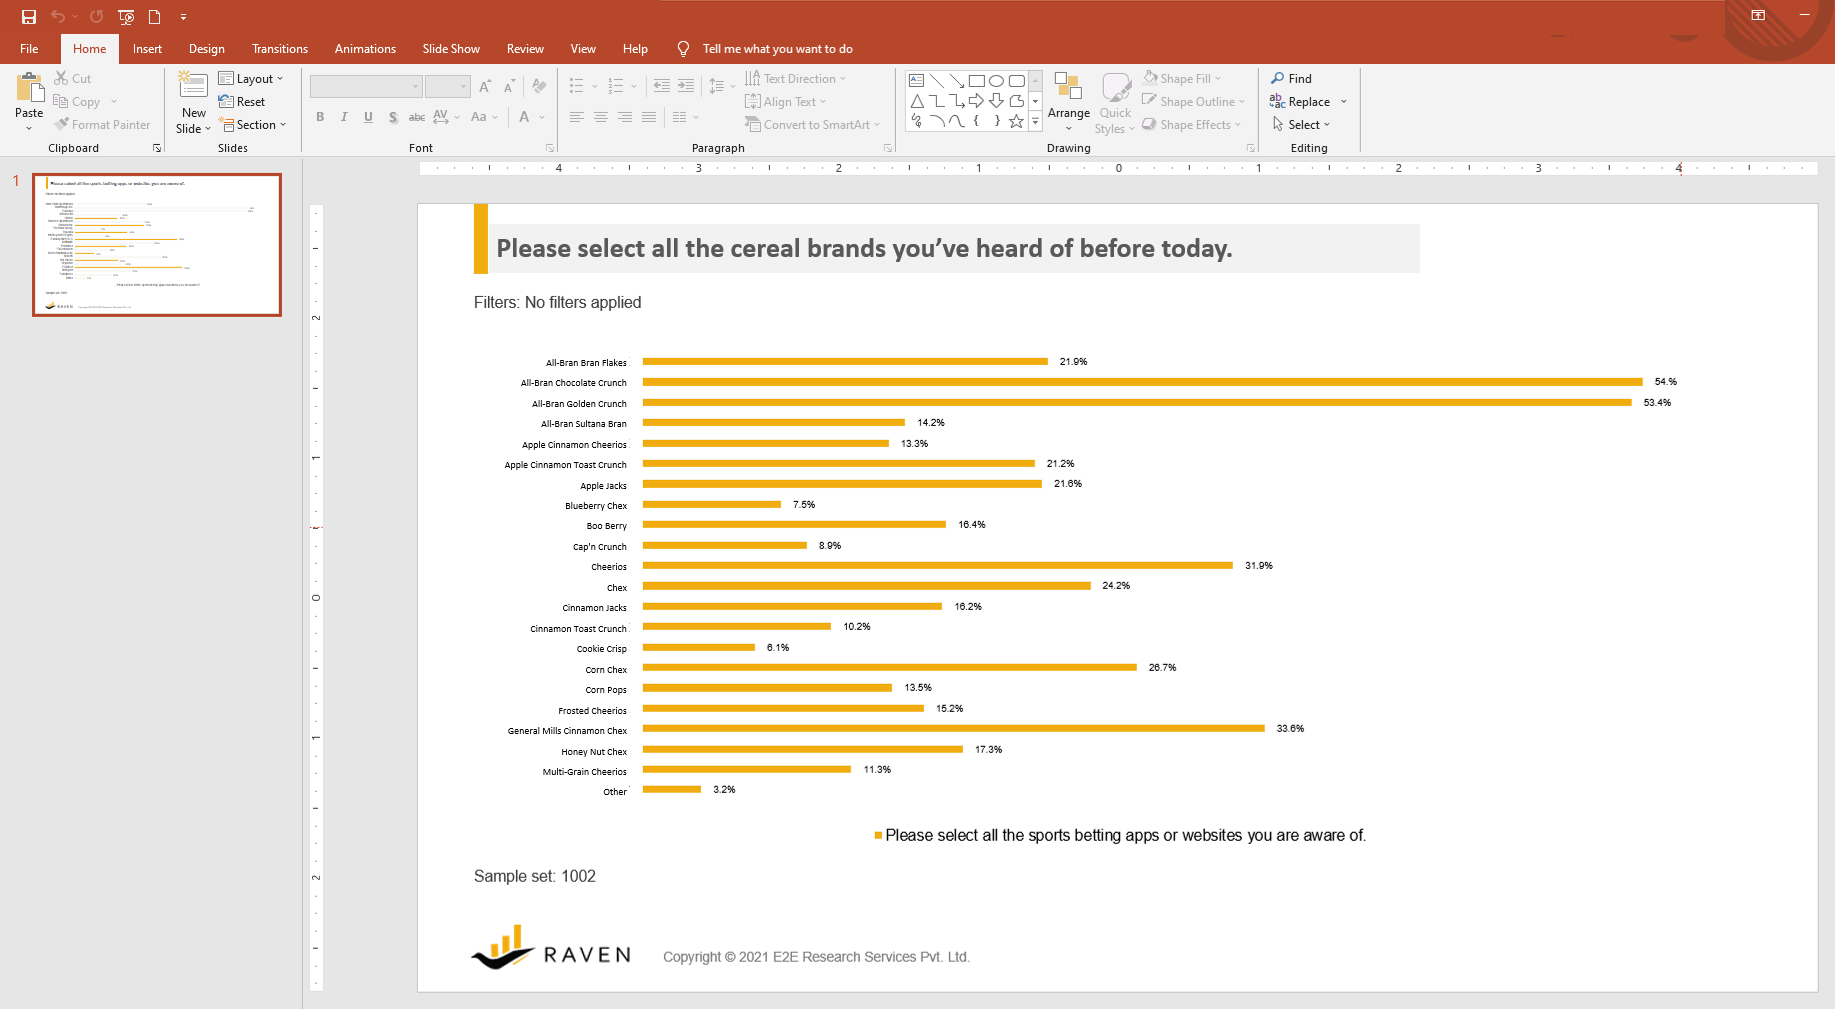 Shareable PPT and PDF Exports
• Quickly export any chart or table into PowerPoint. Drop the chart into your branded template and edit the size, colors, fonts, and more to meet your specific needs.
• For an extra bit of security and to ensure that data aren’t accidentally changed, charts and tables can also be exported to PDF files.
.
.
What have our partners said about Raven so far?
“I wanted to send you a personal email to congratulate you on the dashboard. We presented it to the clients and they were amazed by the tool, the style and the intuitivity. So, I thought it was important to share this with you and to tell you that I was impressed with the progress you made.”
“Oooohhhhhhh wow. That was SOOOOOOO cool! The visual information is a quick read once you get used to looking at it. Our clients better love this and be at least as impressed as I am. 😉 Thanks all who built this. CONGRATULATIONS TEAM!”
 Competitively priced
Raven dashboards are competitively priced for both one-time studies with small sample sizes, as well as large, multi-country, multi-wave trackers. Simple projects are ready for you to dive into in as little as one day!
.
Ready to try Raven?
Are you ready to dive into a beautiful and easy to use dashboard to discover top quality insights about your buyers, brands, and business? Ask for a live demonstration or email your project specifications to our research experts using Projects at E2Eresearch dot com. We’d love to help you turn your enigmas into enlightenment!
.
Learn more from our case studies
- Automating Distribution of BFSI Performance Metrics – A BFSI automated reporting case study
- Building a Holistic Expense Management App with Client-Direct API Feeds | A mobile app case study
- Ensuring Optimal Inventory with SKU Level Demand Forecasting – A consumer products forecasting analytics case study
.
Learn more from our other blog posts
- Trackers Suck. Here’s how to fix them.
- Understanding the difference among basic, advanced, and business analytics requirements to solve your research and business puzzles
- E2E Research and Annie Pettit Receive 2021 Judge’s Choice Forsta AIR Awards for Achievement in Insight and Research
About E2E Research
For more than ten years, E2E Research has specialized in converting enigmas into enlightenment for researchers, business leaders, and insights companies around the world.
As an ISO 27001 certified, ESOMAR corporate member, we offer a full range of market research, data analytics, and business intelligence solutions to help you extend your services, fill the gaps, and create more value for your clients. Services include research and questionnaire design/analysis/reporting, data science and analytics, multiple panel management, scripting/hosting, data validation, digital fingerprinting, tabulation, qualitative coding, written reports, infographics, real-time digital dashboards, and mobile apps.
Award winning research services and solutions from End-to-End.