
Researchers love conjoint analysis. It’s a handy statistical technique that uses survey data to understand which product features consumers value more and less, and which features they might be willing to pay more or less for.
It allows you understand how tweaks to combinations of features could increase desirability and, consequently, purchase price and purchase rate. Essentially, it asks, “Would you buy this product configuration if you saw it on the store shelf right now?”
Technically, there are numerous ways to present conjoint questions but all of them invite participants to compare two or more things. For example:
- Would you rather buy this in red or yellow?
- Would you rather pay $5 for a small one or $4 for a large one?
- Would you rather buy this one or the competitive brand?
- Would you rather buy this one or keep the one you already own?
The comparisons can get extremely complicated as you strive to create scenarios that mirror the complicated options of real life, in-store choices. This is because no two products are have the exact same features. There are always multiple tiny or major things different amongst them including brand, price, color, shape, size, functionality, etc.
As you see in the example conjoint question below, participants are being asked to select from among 5 different entertainment bundles, each with a different price and selection of options. Even though this question is nicely laid out, perhaps even nicer than what you might see in a store, it’s not a simple choice!
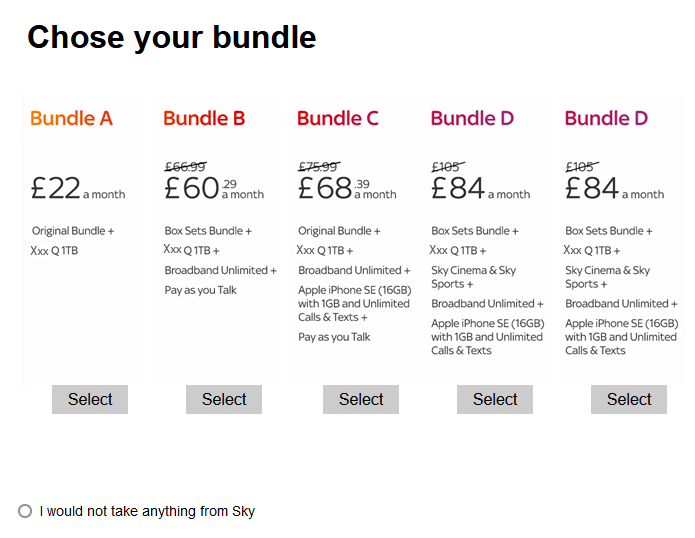
.
Quick Conjoint Dictionary
First, let’s cover some quick terminology commonly used with the conjoint method so that the tips we will offer make sense.
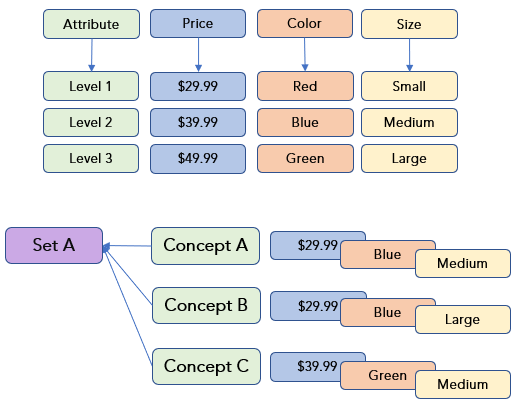
- Attribute: A characteristic of a product or service, e.g., size, shape, color, flavor, magnitude, volume, price.
- Level: A specific measure of the attribute, e.g., red, orange, yellow, green, blue, and violet are levels of the attribute color.
- Concept: An assembly of attributes and levels that reflect one product, e.g., a large bag of strawberry flavored, red, round candy for $4.99.
- Set: A collection of concepts presented to a research participant to compare and choose from.
- Simulator: An interactive, quantitative tool that uses the conjoint survey data to help you review consumer preferences and predict increases or decreases in market share based on potential product features and prices.
.
Conjoint Analysis Tips and Tricks
3 to 5: Across all attributes, levels, concepts, and sets, 3 to 5 is a good rule of thumb. With so many possible combinations of attributes, levels, and sets, the ask we’re making of participants could get overwhelmingly complicated and create a lot of cognitive fatigue. That’s why we suggest aiming for no more than 3 to 5 attributes, 3 to 5 levels per attribute, 3 to 5 concepts per set, and 3 to 5 sets. By ensuring that participants enjoy the process and can take the time to review each concept carefully, we can generate much better data quality.
Meaningful Levels: Choose attribute levels carefully. Do you really want to test 3 shades of blue or 3 flavors or apple? No. While you could choose price levels of $30, $32, and $34, they aren’t meaningfully different and wouldn’t create a lot of indecision on the store shelf. They wouldn’t create variation within your data. Try to include edge cases – options that are as far apart as you can make them while still being within the realm of possibility.
Be frugal with combinations: You already know there are combinations of attributes and levels you would never offer in-store so don’t waste people’s time and cognitive load testing them. Think carefully about which combinations of attributes and levels you would never offer together and exclude them from the test. For example, don’t waste your budget testing the least expensive price and the most expensive feature. Similarly, don’t test the value of adding an extra battery for a version of the product that doesn’t run on batteries.
Minimum number of shows: When testing a level, use it in at least 3 concepts for an individual person. Think of it in terms of a ruler – for quantitative metrics (e.g., price, length, volume, weight), you need to see whether the difference between Level 1 and Level 2 is perceived the same as the difference between Level 2 and Level 3.
 Include competitors: The real market includes competitors, often many. People don’t shop for single brands in isolation and neither should they answer your conjoint questions in isolation. Include at least one key competitor in your test, and preferably at least two. Further, if your brand is relatively unknown, you may wish to incorporate a competitor that is also relatively unknown.
Include an opt-out: Sometimes when you’re shopping, you discover they don’t have what you’re looking for and you leave the store empty handed. Generating realistic data means we must do the same in our simulated shopping trip – let people select “None of these” and leave without choosing anything. Otherwise, people may be “tricked” into selecting options they would never choose in real life.
Easy to read: Remember that conjoint is trying to simulate decisions that would normally happen in-store. Part of the in-store experience is in-store messaging. You’ll rarely see long sentences and paragraphs in the store so avoid them in your conjoint questions too. Use words and phrases that are as close as possible to what someone might see at the store.
 Use imagery: We already know that a conjoint task can be cognitively demanding. That’s why imagery helps. Not only does it help people to visualize the product on the shelf amongst it’s competitive brands, it also helps to create a more visually appealing task (mmmmm cookies!). If you can’t provide an image of your product, find other ways to incorporate visuals in the questionnaire.
Plan for a hold-back sample: When product development work is extremely sensitive or is associated with life and death decisions, e.g., medical or pharmaceutical research, don’t let your budget determine the validity and rigor of your work. Spend the money to get the sample size you truly need to test each attribute and level with the appropriate rigor. And, build time into the fieldwork and data analysis schedule to permit preliminary analyses and test the model. You might need to tweak attributes, levels, or sets prior to running the full set of fieldwork.
Don’t let the statistics think for you: You wouldn’t create an entire marketing strategy based on gender differences just because a statistically significant t-test said 14% of women liked something and only 13% of men liked it. It’s not a meaningful difference. The same thing goes for a conjoint study. Review the model yourself, carefully, regardless of how “statistically significant” it is. Think about the various options suggested by the data. The simulator might reveal that there is a set of attributes and levels that would take over the market but that doesn’t mean you must produce that combination. The human brain is mightier than the spreadsheet!
If you’re curious to learn about the different types of conjoint that are available, this video from Sawtooth Software, presented by Aaron Hill, shares details about a few types of conjoint. E2E Research is pleased to offer all of these types to our clients.
What’s Next?
Are you ready to find out what configuration of your products and services consumers would be most keen to purchase? We’d be happy to help you work though the most suitable combinations of attributes and levels and build a conjoint study that meets your unique needs.
Please email your project specifications to our research experts using Projects at E2Eresearch dot com.
Learn more from our case studies
- Optimizing Trade Promotion Spends with a Pricing Simulator
- Ensuring Optimal Inventory with SKU Level Demand Forecasting – A consumer products forecasting analytics case study
- Identifying Optimal Set of Flavor Variants for Incremental Reach – A Survey, MaxDiff, TURF analysis case study
- Understanding Relative Importance of Healthcare Imaging Features for New Product Development – A survey + MaxDiff case study
Learn more from our other blog posts