Journey maps are commonly created in the market and consumer industry to illustrate a set of steps taken to accomplish a goal. Well designed maps help marketers, brand managers, and researchers understand how people perceive and interact with overt and covert stakeholders, products, channels, and services along their way to completing that final goal.
Journey maps used to be simple, and the details and processes often seemed obvious. Today, however, with the internet in our pockets providing unlimited opportunities to talk to people around the world, learn about millions of new products and companies, and acquire nearly any product within hours or days of hearing about it, journeys are extremely complex. They’ve evolved from linear 5-step journeys into 30-stage ricocheting piles of spaghetti.
As such, it’s important to conduct well-rounded research to ensure erroneous assumptions and misconceptions aren’t included, and to ensure all aspects of the journey, both hidden and obvious, are accounted for.
Journey maps are more complicated and more necessary than ever.
..
.
What kinds of journeys can we map?
 Nearly any journey wherein people progress through a set of stages, interacting with channels or people, over a short or long time frame to accomplish a goal can be mapped. Here are just a few of the more common journey maps that marketers and brand managers use.
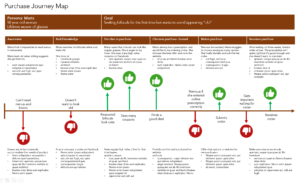
- Customer journeys: How do consumers, or your customers, discover the need for and end up buying a product? Where do they learn about various products, who do they talk to along the way, at what point do they finally buy one and how?
- Patient journeys: How does a patient or care-giver discover a health issue and follow through to a treatment plan? What was the initial point of discovery, who did they talk to about their concerns at each step, when did they choose a healthcare provider, how did they choose from among the treatment options?
- Recruitment journeys: How does a person decide to seek employment and follow through until they have settled into a new role? What created the initial interest, where did they turn to for advice about hiring companies, how did they select a best role?
- Financial journeys: How does a person decide to buy a home and follow through on that major expenditure? What caused the interest in the beginning, where did they go for advice about large loans, and how did they choose a mortgage provider?
.
Why create a journey map?
Maps aren’t simply pretty pictures that make great wall posters. In addition to illustrating an entire journey on one convenient page, they serve a number of important purposes.
- Facts over factoids: Assumptions about processes, pain points, strengths, and weaknesses are easily affected by context and perspective. Every brand manager, marketer, researcher, and customer has a different view of the journey which is affected by their role, life experience, and current needs. Data-driven journey maps are simply more accurate and all-encompassing than anecdata-driven journey maps.
- Resolve issues: By mapping the journey, you’ll be able to identify strengths, weaknesses, and pain points that are negatively impacting people at any stage in the experience. You’ll learn which mobile apps need improved navigation, identify disjointed online and offline experiences that need fixing, and be better able to ensure people receive key messages at critical times via the channel they prefer.
- Optimize spend: Once you discover which channels people are accessing – or not accessing – during their journey and what the strengths, weaknesses, and pain points of those channels are, you can allocate your spend more wisely. You may discover new channels, realize the need to optimize favorite channels, or decide to eliminate out-of-date channels.
- Innovate: Journey maps will help you identify gaps in product development or processes that can be solved by creating new tools, products, or services.
- Plan for the future: When you understand where your business is today, you can plan for tomorrow. Identify which experiences can be enhanced and improved for everyone.
- Level-setting: When everyone has the same understanding of the journey, it’s easier to ensure that every touch-point meets your high standards and best practices. You’ll be better able to reduce silos and increase efficiencies of functions and tools across the company.
- Understand personas/segments: Every product or service can be represented by multiple journey maps, each reflecting a unique segment of people. As you understand each segment more precisely, you can improve each experience in a more targeted, relevant way.
.
How to conduct a journey mapping research project
Set Clear Goals: The most important component of every research project, including journey mapping research, is to set clear goals and objectives for what you want and need to achieve. In addition to creating the map itself, you will need to specify how you intend to use the map once it’s complete. For example:
- Why do so few people use the mobile app?
- How can we better serve omnichannel customers?
- Where are our communication gaps?
- Why do we lose so many consumers after they call our help-line?
Review Secondary Research: Take the time to review any existing qualitative and quantitative research you may have conducted over the last several years. Though it may not directly focus on the journey experience, there are likely to be important tidbits of knowledge that will help you design your data collection instrument – take note of people, processes, and channels mentioned and ensure they are covered in the new instrument.
Detail the Research Questions: As you prepare to build your data collection tool, focus on all aspects of the human experiences – who, what, where, when, why, and how. Let high quality data tell you how many stages there really are rather than trying to fit people into preconceived notions.
- Who: Which personas would benefit the most from journey mapping? Who are the direct and indirect people the consumer could possibly come into contact with? Consider people at the call-center, people answering questions on Twitter, people in finance, operations, and management who may be called in to help with more difficult problems.
- What: What messages and information people need at each stage? What are their motivations? What are they getting or not getting? What are their pain points and barriers?
- Where: Where do customers seek information or products? Are they experiencing the journey from home, work, school, or the retail outlets? Are they experiencing it on a mobile device, a desktop computer, or in person?
- When: Think about how journeys change when they are experienced in the daytime, evening, nighttime, or weekends. Is the journey one day, one week, one month, or one year long?
- Why: Why did customers start or stop each point in the journey?
- How: How do customers feel about each point? How do they perceive each stage? What are they thinking and believing? Where is their breaking point or their moment of exhilaration?
Identify the Research Method: Ideally, both qualitative and quantitative research techniques should be used to ensure you capture all potential aspects of the journey. Starting with qualitative techniques allows you to probe deeply and ensure that subsequent quantitative techniques are properly informed.
- In-Depth Interviews: Whether in-person, over the phone, or virtual, personal interviews are the perfect method for diving deep into every single aspect of an individual’s journey. Not only are first hand accounts great at creating empathy among company stakeholders, the ability to probe with multiple “whys” ensures you can dig down to the inner most held beliefs and opinions associated with a behavior.
- Online Communities: Most journeys last far longer than a few minutes. Buying shampoo could be a ten minute or ten-day journey whereas a house hunting journey could take a year. Online communities are an effective way to bring people together to discuss each other’s unique journeys and discover which steps are common or unique, and why. For consumer goods mapping, you could even ask participants to maintain and share a diary throughout their journey.
- Observational Research: We all know the saying that actions speak louder than words. That’s why it can be extremely beneficial to include observational research as part of journey mapping research. Most commonly, this research is conducted by researchers quietly observing people as they progress through their journey in retail outlets. However, observations can also be made of digital behaviors after first getting permission to record people’s browser activities.
- Surveys: Finally, finishing with a quantitative survey will help ensure your final outcome is not only comprehensive, but also reflective of the broader population. Remember to build surveys that incorporate data quality techniques and include fun question types that help participants remain engaged during the research process.
.
What’s Next?
Are you ready to gain a thorough understanding of your customers’ journeys? Email your project specifications to our research experts using Projects at E2Eresearch dot com. We’d love to help you turn your enigmas into enlightenment!
Learn more from our case studies
- Communicating More Effectively with Insurance Customers – A bulletin board case study
- Mapping a Patient Funnel to Mitigate Treatment Barriers – A cancer patient survey case study
- Removing Customer Barriers to Auto Insurance Renewals – An insurance survey case study
Learn more from our other blog posts
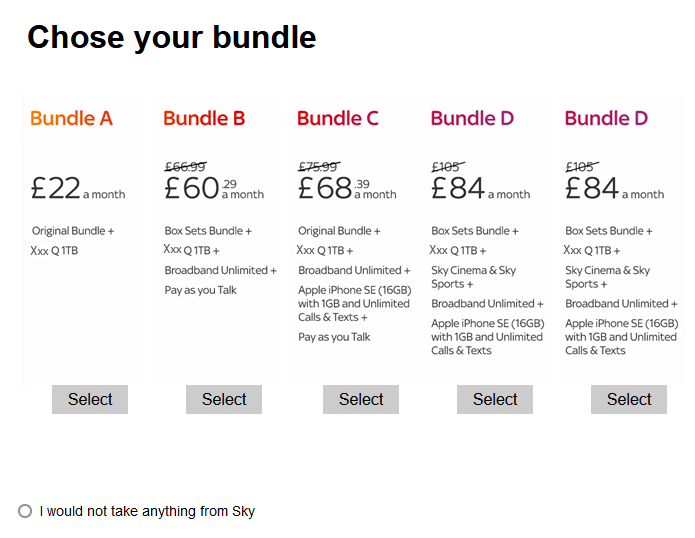
 Include competitors: The real market includes competitors, often many. People don’t shop for single brands in isolation and neither should they answer your conjoint questions in isolation. Include at least one key competitor in your test, and preferably at least two. Further, if your brand is relatively unknown, you may wish to incorporate a competitor that is also relatively unknown.
 Use imagery: We already know that a conjoint task can be cognitively demanding. That’s why imagery helps. Not only does it help people to visualize the product on the shelf amongst it’s competitive brands, it also helps to create a more visually appealing task (mmmmm cookies!). If you can’t provide an image of your product, find other ways to incorporate visuals in the questionnaire.