By E2E Research | July 30, 2021
Secondary research is an under-utilized yet fantastic way to better understand your competitors, build business development strategies, understand regional markets, create market entry strategies, and so much more.
But what exactly is it? Unlike primary research where you create your own data by launching a questionnaire or focus group, secondary research entails using data previously generated for other purposes. If you wrote any literature reviews in high school, college, or university, chances are you already know all about secondary research.  Now that we’re in the business world, secondary research includes finding and analyzing:
- Survey, interview, focus group, mystery shopping, sensory testing, and biometrics research completed by your own company in previous years for other purposes
- Sales, transactional, and logistics data that was originally collected by your company for the purposes of production and fulfillment
- Social listening data collected from social networks, online comments, online reviews, blogs, and other user-generated website content.
- Census research that was conducted by government sources to allocate funding and services throughout the local region or country
- Academic research conducted at colleges and universities, whether it’s been published as a journal article or stuffed in a file drawer because the professor got interested in something else
- Research conducted by competitors and presented at conferences or shared in blogs or industry magazines
- Research conducted by industry associations among their members or their stakeholders
- Research conducted by third-party groups for the sole purposes of selling for profit to other people (you!)
- Data collected by internet search engines such as Google Trends
Some specific sources of secondary data that are often useful for consumer and market researchers include:
- Acxiom – demographic, home, vehicle, shopping, interests data
- Arbitron / Nielsen Audio – radio data
- Comscore – website visits and behaviors, trends, digital/linear/OTT TV viewership
- Datalogix – online click tracking, consumer lifestyles, demographics, audience data
- Dunnhumby – customer data via retailer loyalty programs
- ecommerceDB – traffic of major brands, business trends, revenue by country
- Epsilon – demographic data
- Equifax – financial data
- ExactData – consumer and business names, postal, email addresses
- IQvia – healthcare and pharmaceutical data, anonymous patient data
- IRI – purchase, media, social, loyalty data, consumer, shopper, retail data
- Mintel – new product launches by category
- Numerator – retail purchases
- SimilarWeb – websites traffic trends, sources
The key point is that someone else already generated or curated data to suit their own purposes and now you are taking advantage of it to make further analyses that suit your purposes.
No matter how innovative and ground breaking your research or business problem is, someone has ALWAYS done relevant research prior to you. For example, when the very first academic research examined the validity of online questionnaire data, lots of research had already been conducted to understand the validity of questionnaire data in general. No data exists in a silo!
.
Why use secondary research?
Let’s break secondary research into two overly simplified categories: Basic and complex.
Basic desk research
This is what you do everyday. It might take a few minutes or a few hours but you regularly:
- Do quick online searches of the top 20 brands in a product category so that your questionnaire doesn’t exclude an important brand
- Do a quick Twitter search to see the real words people use when they describe a brand so that you can build more informed focus group discussion guides
- Check your government’s census data to ensure your questionnaire sampling plan is designed to reach a target group that reflects the general population in terms of gender, age, ethnicity, and income
- Read an online blog post to gain a better understanding of a research methodology you don’t use very often (is this you right now?!)
Complex desk research
 On the other hand, complex desk research might take weeks or months depending on how difficult it is find and analyze the information. For instance, developing a new product and introducing it to a new country with existing competitors would benefit from secondary research to address business problems such as:
- What products already exist, what features do they offer, how are they priced?
- What should your product cost given the prices and features of competitive brands and consumer characteristics?
- How big is your market now and how big could it become?
- How can your business identify the most strategic buyers and markets?
- What do your suppliers and customers look like and which are the riskiest?
- Which expansion strategies are effective in different parts of the country or the world?
.
Advantages of Secondary Research
There are disadvantages to every research methodology you might consider. For instance, with secondary research, you won’t always find all the data you need, you’re not always sure about the detailed methodology behind the data collection and reporting, the data will never be complete nor perfect, and you won’t always get the why along with the what. But there are definitely some great advantages that come with triangulating multiple data sources to understand a specific problem.
Prove your worth
When launching a new product, it is important to prove to your boss, investors, and other stakeholders that your idea is worth investing in and you understand what is happening in the market. No idea exists in a vacuum and you need to demonstrate that you understand what your potential market looks like and what could go completely wrong (or completely right!) after you launch.
Avoid wasting time and money
Upon doing your research, you may discover that someone else has already built the amazingly innovative widget you were planning to build. You now have the opportunity to figure out how to differentiate yourself BEFORE wasting time building the exact same widget.
Decrease your margin of error
Why do researchers like large sample sizes? Because the more people you include in a research study, the more you improve your chances of finding the “correct” answer. As just one person, you can only conduct so much research. But, when you invest that time into collecting multiple pieces of research from multiple sources, you will improve your chances of finding the “correct” answer. In the academic world, you could think of this as meta-analysis – when 95 studies prove X and 5 studies prove Y, chances are the X is the “correct” answer. (There often isn’t one correct answer, just a more comprehensive or well-informed answer.)
.
Tips to follow
Like many things, there is an art and a science to finding good quality data and analyzing it well. Here are some helpful tips to ensure you end up with useful secondary research:
Define clear research objectives
 Just because you aren’t designing a questionnaire or interview doesn’t mean you can get away without well defined research objectives. Build a clear plan with specific research questions. Identify the types of data that could answer those questions – census data? Interview data? Sales data? It’s okay to start the research process with random searching in random places just to get a sense of what you know and don’t know. But, once you’ve used up that allotted discovery time, be specific and detailed about your next steps.
Create a framework for discovery
Rather than randomly looking for things, build a framework that will help you plan and organize. For example, “think, feel, do” is a common framework. As you seek out information, look for data that helps you understand what people 1) think, 2) feel, and 3) do. Other frameworks might specify “buyers, brands, and businesses,” or “finances, logistics, and transactions,” or “design, field, analyze, report.” Focus on addressing the research problem from multiple angles – time frame, geography, target audience, metrics, and products. Whatever framework you build for yourself, it will help ensure that you cover all aspects of the business problem.
Seek a range of sources and data types
Look for government data, association data, academic data, newspaper data, and think tank data. Find qualitative and quantitative data, business and personal data, user and non-user data, customer and consumer data. Figure out all the types of places where your data could be and make sure it all gets a chance to be represented.
Don’t dismiss old data
Sales numbers, technology, and business processes might change quickly but human behavior changes soooo veeeeery slooooooowly. It’s often reasonable to skip over the technology part of older research – we don’t care about floppy disks, cathode ray tubes, and dot-matrix printers anymore. However, make sure to pay close attention to the human side of things. If people didn’t like something five years, their perceptions and emotions behind those dislikes could very well still be valid.
Seek out contradictions
It’s easy to find a set of data that offers conclusions you like and continue on the same path. But, that could lead you down one single path when there are actually multiple paths, all with enlightening and valid outcomes. That’s not to say you should entertain bad, wrong, or unethical ideas just because they are other ideas. Make sure you consciously seek out other ideas and actively reject them for good reasons rather than rejecting them because you didn’t know they existed.
Expect and confront bias
Try to identify potential sources of bias– age, gender, ethnicity, disability, sexuality, language, country, political, societal. You might not realize the bias there unless you specifically look for it. Once you’ve found it, then you can decide what to do about it. We’ve learned so much about bias in the last few years. This is your opportunity to stretch your new muscles.
Validate everything
Just because something is on the internet doesn’t mean it is good, right, or true. Heck, computers at the library are free to use, WordPress hands out blogs sites for free, and anyone can instantly create “The Authoritative Guide to Three Hour Questionnaires.” Unless that website was endorsed by ESOMAR, the Insights Association, and the Canadian Research Insights Council, I wouldn’t give it a nanosecond of my time.
Consider the Source: Who collected the data? Are they reputable? Do respected experts reference them? Do they treat those who disagree with them with respect? Do they point out the drawbacks, faults, and biases of their own research? Who complains about them in social media? Further, just because some data is created for the purposes of selling it for profit to multiple third parties doesn’t mean it’s biased… but it doesn’t inherently mean it’s trustworthy either.
Consider the Data: When was it collected? When was it published? How was the data checked for quality? What data might be missing or incomplete? Are key words specifically defined and not left to the imagination? Are the sample sizes appropriate to draw conclusions from? Is the sample reflective of the population it’s supposed to represent?
Include everything
When you’ve completed your thorough analysis, incorporate all of the data that led you to your final set of conclusions. This means including valid and trustworthy information that you agree with as well as valid and trustworthy data you disagree with. Share the entire set of information so that other people can come to their own conclusions too. If you’ve laid out your argument well, they should come to similar conclusions as you did.
..
What’s Next?
If you’ve got a simple secondary research project ahead of you, enjoy the process and leverage the time and money that someone else put into the research you’re benefiting from.
But, if you’ve got a complex and lengthy project ahead of you, our experienced desk researchers would be happy to help. Email your project specifications to our research experts using Bids at E2Eresearch dot com and we’ll lighten your load.
Learn from our case studies
Learn from our other blog posts

 You might also hear these referred to as ‘Census Rep’ samples. A census rep sample requires access to census data, something that is typically generated by large-scale government surveys completed by millions of their residents or citizens. In the USA, that’s census.gov and in Canada, that’s Statistics Canada.
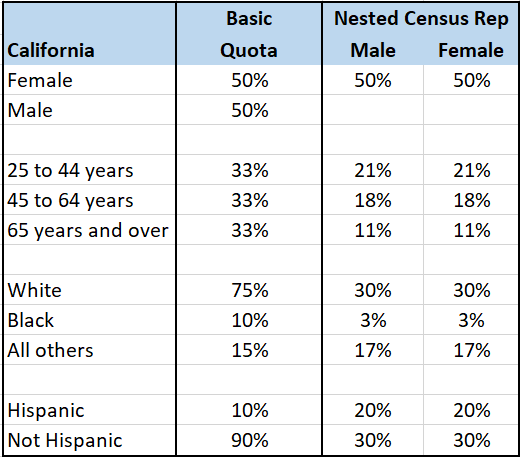 Creating a census representative sample is extremely important. You could get into trouble if you recruit a sample of research participants who don’t look like actual users.
 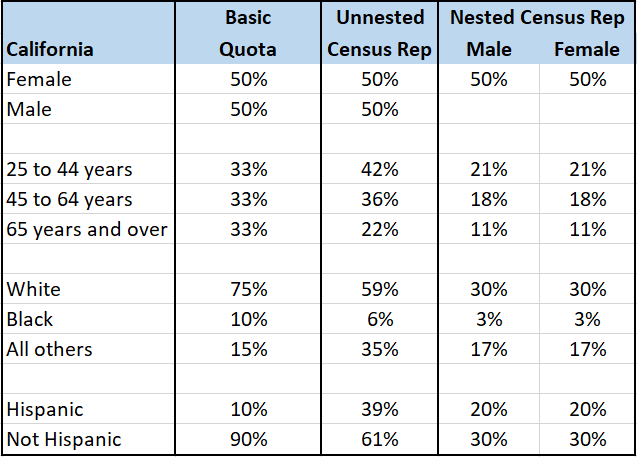 To start, we need to define a census rep sample of California. First, we find those people in a census dataset. Then, we identify the frequencies for each of the key demographic criteria – what is the gender, age, ethnicity, and Hispanic background (as well as any other important variables) of the people who live in California. Fortunately for us, this data is readily available. On the census.gov website, we learn that in California, 50% of people are female, 6% are Black, and 39% are Hispanic.


 Include competitors: The real market includes competitors, often many. People don’t shop for single brands in isolation and neither should they answer your conjoint questions in isolation. Include at least one key competitor in your test, and preferably at least two. Further, if your brand is relatively unknown, you may wish to incorporate a competitor that is also relatively unknown.
 Use imagery: We already know that a conjoint task can be cognitively demanding. That’s why imagery helps. Not only does it help people to visualize the product on the shelf amongst it’s competitive brands, it also helps to create a more visually appealing task (mmmmm cookies!). If you can’t provide an image of your product, find other ways to incorporate visuals in the questionnaire.