Request a quote!

Blog, News &

Case Studies

A Beginner’s Guide to Usage and Attitude Studies
By E2E Research | January 11, 2023

Ah, a rose by any other name smells just as sweet! Roses? Well, instead of using the phrase Usage and Attitude, you might hear some people use the phrase Habits and Practices. And instead of shortening it down to U&A, they’ll shorten it down to H&P. Whether you’re interested in a U&A or an H&P, we’re generally talking about the same thing. Use the acronym you prefer and we’ll all gain more valuable insights into consumer behavior, attitudes, and usage patterns.


What is a Usage and Attitude Study?

Decorative imageUsage and Attitudes studies aim to understand a broad range of behaviors and attitudes related to the people experiencing a product or service. It’s relevant for all products like food, beverages, hair care, and electronics, as well as services like healthcare, banking, and education.


Most U&As gather information about the brand of interest, as well as competitive brands and the category as a whole. This ensures you gain a full understanding of any behaviors and attitudes that could eventually be relevant and important to the brand of interest.


Why is a Usage and Attitude Study Important?

U&As create a solid foundation for building a brand. They serve a number of important benefits in a variety of key areas.


People: Know your buyer and your consumer
  • Create more relevant and memorable messaging by understanding the unique demographic and psychographic characteristics of each segment of users that has been identified in any segmentation research you’ve conducted
  • Understand purchase drivers associated with each persona, e.g., price, availability, loyalty, packaging, sensory features, sustainability, durability
  • Plan for the future by identifying what each segment needs and wants from an ideal product
  • Differentiate between the needs of buyers (e.g., availability, pricing) and users (e.g., efficacy, sensation), and ensure the targeted message reaches each audience


Place: Know your buyers’ preferred information and purchase channels
  • Focus your marketing spend in the most effective channels by identifying the marketing and sales channels and influencers that are most effective and important at each stage of the purchase journey


Pricing: Know your buyers’ preferred pricing models
  • Create the most effective pricing model by understanding attitudes towards various pricing strategies, e.g., every day low pricing vs sales vs bundling


Promotion: Know your buyers’ preferred promotion tactics
  • Create the most effective promotion model by understanding which types of promotions are relevant for your buyers, e.g., in-store promotions, OOH promotions, door-to-door promotions


Product: Know what your consumer needs and wants from your product
  • Prevent switching and abandonment by identifying and resolving frustrations, complaints, and pain points
  • Encourage purchase by identifying and reminding people of desired benefits and advantages
  • Plan product improvements by understanding which product features people love and hate


Strategy: Know how to position and plan for the future

Decorative image


What Questions to Ask in a Usage and Attitude Study

Decorative imageAs with any research project, there is an unlimited number of questions that could be asked. The key is to identify the specific research objectives for the imminent research project and focus the questions there.


Then, select a set of engaging questions that will keep the entire questionnaire to less than 15 minutes long. Don’t try to do everything or the data quality will suffer.


Brand Metrics
  • Awareness: When you think of this product category, which brands come to mind first?
  • Aided Awareness: From this list of brands, which ones have you heard of?
  • Discovery: How did you first hear about this brand?
  • Trial: Which brands of this category have you ever tried?
  • Trial: Why did you decide to try this brand?
  • Consideration: When you think of this product category, which brands would you consider buying?
  • Consideration: From this list of brands, which ones would you considering buying?
  • Preference: When you think of this product category, which brand do you most prefer?
  • Loyalty: If your preferred brand was not available in your usual store, what would you do?
  • Perceptions: Which 5 of these words reflect your opinions about this brand?
  • Perceptions: What 3 things do you like about this brand? What 3 things do you dislike about this brand?
  • Perceptions: Which of these brands is most innovative? Fun? Likeable? Effective? Appealing? Different?
  • Perceptions: What is your opinion about the effectiveness of this brand? Quality? Appearance? Texture? Taste? Scent? Sound? Durability? Sustainability?
  • Perceptions: Overall, what is your opinion about this brand?


Product Usage
  • In your household, which of these people use this category?
  • In your household, who uses this category most often?
  • Where in your home is this category used?
  • At what time of day/week/month/year is this category used?
  • How is this category used?
  • What occasions is this category used for? Every day? Holidays? Religious days? Birthdays?
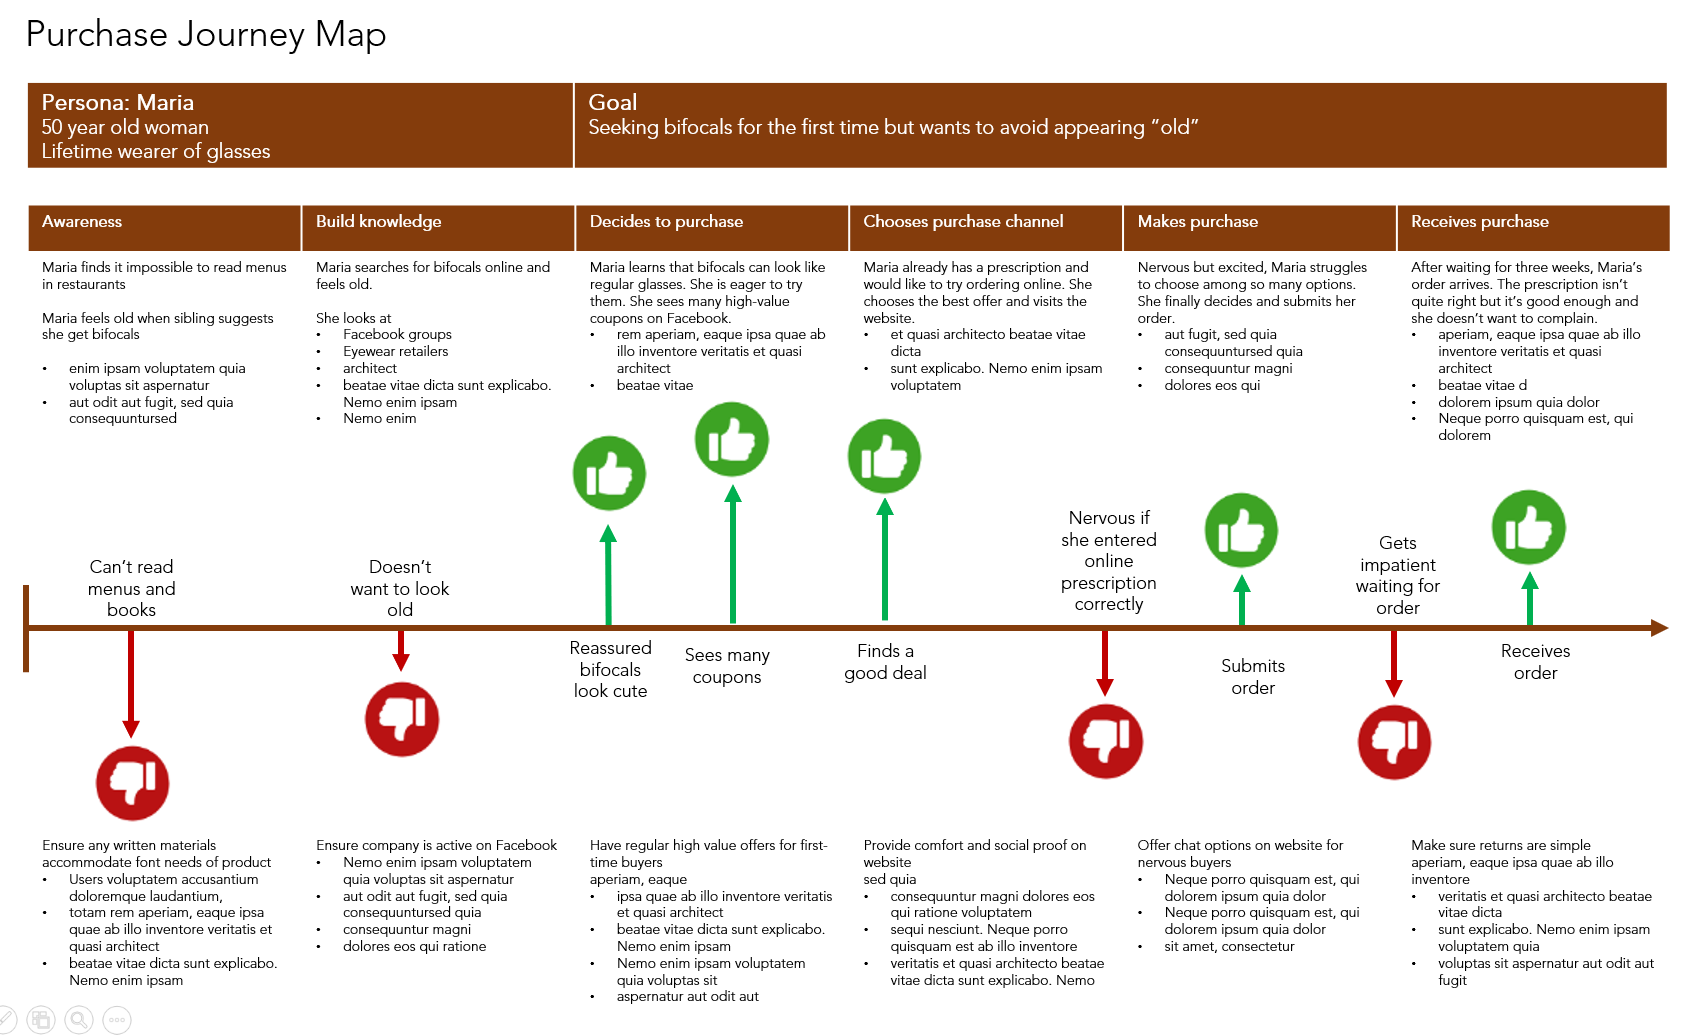


Decorative imagePurchase Journey:
  • Who usually buys the product?
  • What are all the places where this category/brand is bought?
  • Where is this category/brand usually bought?
  • Where do you prefer to buy this category?
  • On the next shopping trip, which brands will be bought?


Purchase Frequency / Recency / Monetary
  • How often is each of these brands bought?
  • How often is each of these brands used?
  • In just the last 7 days, which of these brands have been bought?
  • When was the last time each of these brands have been bought?
  • What size package of category/brand is usually bought? What size is preferred?
  • At what time of the day/week/month/year is this brand/category usually bought?
  • The last time this category/brand was bought, about how much was spent on it?
  • The last time this category/brand was bought, were any coupons or cost savings used?
  • What is your opinion about using coupons? Buying at regular price? BOGOs?


Personal Details
  • Demographics: Age, gender, income, education, ethnicity, religion, household size, children in home
  • Psychographics: Personal attitudes towards relevant category characteristics, e.g., sustainability, early adoption, pricing preferences


Why Ask About Behaviors that Can Be Measured Digitally?


Decorative imageIf time and money were no objectives, many metrics could be confirmed visually or digitally. Sometimes, however, it’s faster and easier to just ask people. Sometimes the data isn’t available in a properly formatted, readable database. Sometimes the data isn’t available for purchase. And sometimes, we need to match attitude data with behavior data for specific people.


Or, and this is much more interesting, maybe we want to understand what people think they are doing. The way people think about or recall their behaviors is an indirect measure of awareness, loyalty, believability, and likeability. If people can’t remember which brand they buy, whether the name or the logo, that’s not a great indicator of brand loyalty which could permit a premium pricing strategy.


What’s Next?

Most brands are well served to conduct a U&A study. If you’re ready to discover top quality insights about your buyers, brands, and business, email your project specifications to our research experts using Projects at E2Eresearch dot com. We’d love to help you turn your enigmas into enlightenment!


Learn more from our case studies


Learn more from our other blog posts


How to conduct a journey mapping research project
By E2E Research | December 2, 2021

Journey maps are commonly created in the market and consumer industry to illustrate a set of steps taken to accomplish a goal. Well designed maps help marketers, brand managers, and researchers understand how people perceive and interact with overt and covert stakeholders, products, channels, and services along their way to completing that final goal.


Journey maps used to be simple, and the details and processes often seemed obvious. Today, however, with the internet in our pockets providing unlimited opportunities to talk to people around the world, learn about millions of new products and companies, and acquire nearly any product within hours or days of hearing about it, journeys are extremely complex. They’ve evolved from linear 5-step journeys into 30-stage ricocheting piles of spaghetti.


As such, it’s important to conduct well-rounded research to ensure erroneous assumptions and misconceptions aren’t included, and to ensure all aspects of the journey, both hidden and obvious, are accounted for.


Journey maps are more complicated and more necessary than ever.
..

.

What kinds of journeys can we map?

Nearly any journey wherein people progress through a set of stages, interacting with channels or people, over a short or long time frame to accomplish a goal can be mapped. Here are just a few of the more common journey maps that marketers and brand managers use.


  • Customer journeys: How do consumers, or your customers, discover the need for and end up buying a product? Where do they learn about various products, who do they talk to along the way, at what point do they finally buy one and how?
  • Patient journeys: How does a patient or care-giver discover a health issue and follow through to a treatment plan? What was the initial point of discovery, who did they talk to about their concerns at each step, when did they choose a healthcare provider, how did they choose from among the treatment options?
  • Recruitment journeys: How does a person decide to seek employment and follow through until they have settled into a new role? What created the initial interest, where did they turn to for advice about hiring companies, how did they select a best role?
  • Financial journeys: How does a person decide to buy a home and follow through on that major expenditure? What caused the interest in the beginning, where did they go for advice about large loans, and how did they choose a mortgage provider?

.

Why create a journey map?

Maps aren’t simply pretty pictures that make great wall posters. In addition to illustrating an entire journey on one convenient page, they serve a number of important purposes.


  • Facts over factoids: Assumptions about processes, pain points, strengths, and weaknesses are easily affected by context and perspective. Every brand manager, marketer, researcher, and customer has a different view of the journey which is affected by their role, life experience, and current needs. Data-driven journey maps are simply more accurate and all-encompassing than anecdata-driven journey maps.
  • Resolve issues: By mapping the journey, you’ll be able to identify strengths, weaknesses, and pain points that are negatively impacting people at any stage in the experience. You’ll learn which mobile apps need improved navigation, identify disjointed online and offline experiences that need fixing, and be better able to ensure people receive key messages at critical times via the channel they prefer.
  • Optimize spend: Once you discover which channels people are accessing – or not accessing – during their journey and what the strengths, weaknesses, and pain points of those channels are, you can allocate your spend more wisely. You may discover new channels, realize the need to optimize favorite channels, or decide to eliminate out-of-date channels.
  • Innovate: Journey maps will help you identify gaps in product development or processes that can be solved by creating new tools, products, or services.
  • Plan for the future: When you understand where your business is today, you can plan for tomorrow. Identify which experiences can be enhanced and improved for everyone.
  • Level-setting: When everyone has the same understanding of the journey, it’s easier to ensure that every touch-point meets your high standards and best practices. You’ll be better able to reduce silos and increase efficiencies of functions and tools across the company.
  • Understand personas/segments: Every product or service can be represented by multiple journey maps, each reflecting a unique segment of people. As you understand each segment more precisely, you can improve each experience in a more targeted, relevant way.

.

How to conduct a journey mapping research project

Set Clear Goals: The most important component of every research project, including journey mapping research, is to set clear goals and objectives for what you want and need to achieve. In addition to creating the map itself, you will need to specify how you intend to use the map once it’s complete. For example:


  • Why do so few people use the mobile app?
  • How can we better serve omnichannel customers?
  • Where are our communication gaps?
  • Why do we lose so many consumers after they call our help-line?

Review Secondary Research: Take the time to review any existing qualitative and quantitative research you may have conducted over the last several years. Though it may not directly focus on the journey experience, there are likely to be important tidbits of knowledge that will help you design your data collection instrument – take note of people, processes, and channels mentioned and ensure they are covered in the new instrument.


Detail the Research Questions: As you prepare to build your data collection tool, focus on all aspects of the human experiences – who, what, where, when, why, and how. Let high quality data tell you how many stages there really are rather than trying to fit people into preconceived notions.


  • Who: Which personas would benefit the most from journey mapping? Who are the direct and indirect people the consumer could possibly come into contact with? Consider people at the call-center, people answering questions on Twitter, people in finance, operations, and management who may be called in to help with more difficult problems.
  • What: What messages and information people need at each stage? What are their motivations? What are they getting or not getting? What are their pain points and barriers?

  • Where: Where do customers seek information or products? Are they experiencing the journey from home, work, school, or the retail outlets? Are they experiencing it on a mobile device, a desktop computer, or in person?
  • When: Think about how journeys change when they are experienced in the daytime, evening, nighttime, or weekends. Is the journey one day, one week, one month, or one year long?
  • Why: Why did customers start or stop each point in the journey?
  • How: How do customers feel about each point? How do they perceive each stage? What are they thinking and believing? Where is their breaking point or their moment of exhilaration?

Identify the Research Method: Ideally, both qualitative and quantitative research techniques should be used to ensure you capture all potential aspects of the journey. Starting with qualitative techniques allows you to probe deeply and ensure that subsequent quantitative techniques are properly informed.


  • In-Depth Interviews: Whether in-person, over the phone, or virtual, personal interviews are the perfect method for diving deep into every single aspect of an individual’s journey. Not only are first hand accounts great at creating empathy among company stakeholders, the ability to probe with multiple “whys” ensures you can dig down to the inner most held beliefs and opinions associated with a behavior.
  • Online Communities: Most journeys last far longer than a few minutes. Buying shampoo could be a ten minute or ten-day journey whereas a house hunting journey could take a year. Online communities are an effective way to bring people together to discuss each other’s unique journeys and discover which steps are common or unique, and why. For consumer goods mapping, you could even ask participants to maintain and share a diary throughout their journey.

  • Observational Research: We all know the saying that actions speak louder than words. That’s why it can be extremely beneficial to include observational research as part of journey mapping research. Most commonly, this research is conducted by researchers quietly observing people as they progress through their journey in retail outlets. However, observations can also be made of digital behaviors after first getting permission to record people’s browser activities.
  • Surveys: Finally, finishing with a quantitative survey will help ensure your final outcome is not only comprehensive, but also reflective of the broader population.  Remember to build surveys that incorporate data quality techniques and include fun question types that help participants remain engaged during the research process.

 .

What’s Next?

Are you ready to gain a thorough understanding of your customers’ journeys? Email your project specifications to our research experts using Projects at E2Eresearch dot com. We’d love to help you turn your enigmas into enlightenment!


Learn more from our case studies


Learn more from our other blog posts


Getting started with consumer, customer, and market segmentation
By E2E Research | November 16, 2021

In market and consumer research, segmentation is the process of categorizing consumers, customers, companies, or markets into distinct groups or segments based on your desired criteria.


The hope is that each member of a segment shares a set of characteristics with others in their segment, characteristics that are distinct from members of the other segments. Oranges with oranges, and bananas with bananas.


Why is segmentation so important?


Decorative imageWell, we know that people don’t care about everything. They care about things that are particularly relevant to their situation – their demographics, their psychographics, their hobbies, their political views, their geographical location.


Rather than broadcasting the same market messages to everyone or the offering the same product to everyone, segmentation allows marketers and advertisers to increase the odds that people will notice, pay attention to, and act on messages they see because those messages are particularly relevant to them. That means directing chew toy promotions to people who have dogs, gardening products to gardeners who love succulents, and restaurant promotions to area residents who love Indian food.  This targeted approach leads to increased appeal, trial, and repurchase.


As with any research study, segmentation research is fluid. In response to cultural, political, social, and economic shifts over time, consumer opinions and behaviors evolve in response.

The behaviors and targeting strategies of marketers, advertisers, and business leaders must also evolve in response. When major events such as pandemics and extreme economic uncertainty take place, existing segmentation strategies can quickly become irrelevant, necessitating a refresh before a typical 3 to 5 year period is up.

.

.

What and who can be segmented?


Just about anything can be segmented!


  • Consumers: Consumers are people who use products and services from food and beverage to personal care items to financial services – basically everyone! Consumers can be segmented into an infinite number of categories depending on your unique needs.
  • Customers: Customers are a segment of consumers. They are the people who use or buy the specific product YOU sell.  Ideally, you want to find segments of consumers that could become your customers.
  • Markets: Markets can also be segmented based on many criteria to find geographical regions, retailer categories, or channel categories where your product or service would be best suited for use.

.

.

What are the key benefits of segmentation?


There are many benefits of a market segmentation but what follows are a few key benefits. Segmentation allows you to:


  • Identify most and least valuable people: Segmentation research will help you identify nuggets of gold, those groups of people who have the highest ROI, so you can increase your targeting and resourcing efforts with them. Similarly, segmentation will help you identify who has the weakest ROI so you can consider decreasing any resources focused on them.
  • Identify unknown people: Segmentation research may identify an important group of consumers you were previously unaware of, or a product feature that warrants extra or different messaging or promotions.
  • Improve connections with people: Following through on segmentation strategies proves to consumers you understand and will address their unique needs. This increases your likeability and top of mind awareness.
  • Create products that are more desirable: When you understand the unique needs of various segments, you can improve existing and create new products and services that are better equipped to meet their needs, leading to increased trial and repurchase.
  • Create promotions, pricing, and placements that are more desirable: Once you’ve created or improved a product, you will be better able to identify the best pricing and promotion models, and best channels for each segment. In other words, fewer dollars are wasted on ineffective strategies and more dollars go towards effective strategies.

.

.

What are the key features of a successful segmentation model?


Consumers, customers, companies, and markets can be described in many different ways. However, without these four characteristics, a segmentation strategy is sure to fail. As you build your model, make sure it incorporates each of these four requirements.


  • Operationalizable: Each segment must have describable characteristics. For example, it’s impossible to target people who have some kind of, strange, well, you know, emotional sort of feeling about soup. However, you CAN act on people who visit a soup shop every month, who buy soup once a week, or who select “Strongly agree” to a question like “Eating soup makes me feel happy.”
  • Actionable: Segments must be described in a way that allows members to be found. For instance, without knowing where someone lives, you cannot deliver a soup coupon to their door. Or, if they don’t use a TV, it makes no sense to create a television commercial for them about soup.
  • Size of Opportunity: Segments must be large enough to warrant the cost of targeting them. You may be able to identify 400 people who would be interested in soup made with insects but…
  • Value of Opportunity: Segments must have sufficient value to warrant the cost of targeting them. Targeting a segment of people who are interested in soup made with insects is not worth the investment if they’ll only buy it once as joke.

.

.

What are the types of segmentation models?


The best segmentation models are effective because they incorporates a range of complementary demographic, geographic, psychographic, and behavioral variables.


If you’re a visual / audio learner, here’s a quick video summary for you.

.

.

.


Demographic Variables


Common variables: Age, gender, ethnicity, education, income, occupation, family size, religion, language, dialect, life stage.


Source of data: Questionnaires, focus groups, census data, third party data, data aggregators.


Because demographic data is so readily available, segmenting people based solely on their demographics is the simplest and most common strategy. Retirement homes target people based on age, and children’s campgrounds target people based on the presence of children in a home.


But, ease of targeting is definitely not always reflective of the quality of the targeting. Some older people move in with their families and not all families can afford to send their children to camp.


.


Geographic Variables


Common variables: Region, country, state, city, neighborhood, zip.


Source of data: Postal lists, mailing lists, census data, third party data.


Geographical data is also fairly easy to acquire and particularly easy to action on. It’s helpful for many products and services that are associated with distinct geographical regions. Restaurants target people in specific neighbourhoods with door-to-door flyers, children’s camps target families in specific cities, and some products may only be legal in specific countries. For increased relevance, geographic segmentation is often combined with demographic segmentation.


.


Behavioral Variables


Common variables: Product use or frequency, purchase behaviors, coupon use, retailer visits, lifestyle behaviors, hobbies.


Source of data: Transactional databases, loyalty databases, association membership lists, employee databases, website click-streams.


Behavioral data can be more expensive to acquire and, hence, this type of segmentation is less common. It focuses on how people behave, including what, when, and how they do it. That could mean which products they buy, whether they buy them in-store or online, or more personal behaviors such as how often they go to the movies or where they go on holidays.


As most researchers and marketers know, the best way to predict future behavior is by knowing past behavior. As a result, behavioral segmentation can be extremely effective.


.

Psychographic Variables


Common variables: Lifestyle, opinions, attitudes, beliefs, values, interests, personality.


Source of data: Surveys, focus groups, interviews, online communities.


Unlike behavioral variables that tell you WHAT someone does, psychographic variables tell you WHY they do those things. This type of segmentation is generally the most difficult because it is difficult to see and difficult to action on.


Psychographic data help us understand why people make specific choices such as why they use coupons even though they can afford luxury brands, or why they don’t watch musicals at the theater even though they love watching musicals on TV.


.

Business Variables


Common variables: Industry, revenue, company size, job title, decision making powers.


Source of data: Surveys, third party data, data aggregators, census data, secondary research.


It’s important to remember that, not only can we segment people, we can also segment companies for B2B purposes. There may be far fewer companies but businesses still need to understand the segments of potential buyers that are more and less relevant for them to target.


.

What’s Next?


Are you ready to discover top quality insights about your buyers, brands, and business? Email your project specifications to our research experts using Projects at E2Eresearch dot com. We’d love to help you turn your enigmas into enlightenment!


.

Learn more from our case studies


Learn more from our other blog posts


8 (Not-So) Secret Strategies for Great Market and Consumer Research
By E2E Research | August 25, 2021

The secret to successful research may not be a secret but in the hustle and bustle of work, we often forget one or more of them. If that describes your day today, then consider this your quick and friendly reminder!


#1 Don’t sell: solve problems.

As researchers, our job isn’t to sell questionnaire design, scripting, data analysis, report writing, and dashboards. Those may in fact be the specific services we offer but our real job is help our partners discover practical solutions to their business problems – Why isn’t this SKU selling, what new product do consumers want, who are my customers, how can I upsell to a target audience, how can I complete more projects when half my team is on holidays, how can I help a client when I don’t have all the services they need?


Our job is to thoroughly understand the business and research problems, and then translate them into appropriate solutions. Whether it’s concept studies, customer segmentation, journey mapping, market forecasting, or providing professional services, if we can’t translate a need into a custom solution, we’ve not done our job.


#2 Know your audience

A lot of market research starts by truly understanding a specific audience. Who are they – what are their hobbies, where do they live, where do they work, what does their family look like? It’s really easy to calculate a median age and the percentage of customers who are female but the last few years have taught us a lot about intersectionality – it’s not just “women,” it’s “disabled Black women.” In the research world, we understand this as customer segments or personas.


After conducting a well-designed survey, focus group, personal interviews, social listening, or analytics, you’ll have the necessary data to run a reliable segmentation and identify 3 to 5 distinct target groups of people within your ideal audience. For example, a couple of common ones are Primary Grocery Shoppers and Moms of Infants.


Once the data has spoken, you can then build a unique buyer persona, a fictional character, for each target group to clearly outline each one’s unique characteristics. This will make developing a set of products, prices, messaging, and marketing that genuinely resonates with each one much easier.


#3 Map your marketing

Researchers spend a lot of time mapping journeys – shopper journeys, patient journeys, student journeys, employee journeys. Building products that people want to use and buy means understanding the wants, needs, and challenges customers experience at every stage of the journey. You might discover that the most problematic stage, in fact, is not the most problematic stage.


Build a plan to understand every stage of the journey from end to end. As eloquently shared by Biz Davis from Abacus Agency, you need to understand whether your brand is lacking in awareness, interest, consideration, purchase, or advocacy, and whether consumers want to be entertained, inspired, educated, convinced, or delighted.


#4 Think like you search

If you’ve written a questionnaire before, you know how important this tip is. Sure, you could write a questionnaire as if you were Charles Dickens showing off his stunning, grammatically correct 200-word sentences with multiple, embedded clauses.


Or.


You could search on TikTok and Twitter and find out how people really talk. Use phrases regular people use. Use words everyone understands even if there’s a technically more precise word. Write questions and answers the same way people search and you’ll end up with a questionnaire that people want to answer!


#5 Promote your content

In the marketing world, this means thinking about native ads, social sharing, and cross-channel marketing. But for researchers, it means sharing your research across the company – from researcher to brand manager to innovation team to development team to marketer.


When everyone in the company is familiar with the results of your research, they can each do their part to amplify the outcome of the insight.


#6 Tell a great story

How do you get colleagues to share your research? Easy! Well, it’s not that easy. Storytelling is a necessary skill that will carry your research results throughout the company. Let people know what is exciting about the insights, how they could be used to reach consumers in unexpected ways, how they could personally benefit from understanding the results.


And sure, though the bulk of the research will be educational, informative, and standard, be sure to incorporate just a small bit of fun along the way.


#7 Become an authority

Don’t rest on the laurels of the research you did last year. That’s old news now. The theory may be correct but times and technology have changed. Follow up last year’s study with one that builds on what you’ve learned from your colleagues, seen among your competitors, and witnessed in related industries.


Show your colleagues what your brand could become if everyone worked together to leverage new, innovative research methods, techniques, and skills. Become the expert at your company who constantly pushes everyone forward towards building a better product and a better company. Get that seat at the table.


#8 Start small to grow big

You could build and execute a 5-year research plan.


Or, you could start small with a single project that gives you a solid overview of one product or target audience. Inhale it, memorize it, internalize it.


Then build the five-year plan. Because at this point, you’ve seen all the strengths and weaknesses among a specific product, how your colleagues work together, how your company systems work, and what’s happening in your industry. You have perspective now.


Now you get it. Now you can think really big.


My inspiration for this post?

I watched a webinar given by Biz Davis from Abacus Agency in Toronto in which he shared a bunch of his secrets for building an effective marketing strategy. The webinar will be posted on their website very soon so do go have a peek.


While watching, all I could think was how relevant his secrets were, in particular, for market and consumer researchers. The headers are his words, and I riffed on the ideas to bring you the research tips.


Are you ready to plan a great market or consumer research project from End to End? Email your project specifications to our research experts using Projects at E2Eresearch dot com.


Learn more from our other blog posts

Everything You Need to Know about Conducting Effective Secondary Research
By E2E Research | July 30, 2021

Secondary research is an under-utilized yet fantastic way to better understand your competitors, build business development strategies, understand regional markets, create market entry strategies, and so much more.


But what exactly is it? Unlike primary research where you create your own data by launching a questionnaire or focus group, secondary research entails using data previously generated for other purposes. If you wrote any literature reviews in high school, college, or university, chances are you already know all about secondary research. Now that we’re in the business world, secondary research includes finding and analyzing:


  • Survey, interview, focus group, mystery shopping, sensory testing, and biometrics research completed by your own company in previous years for other purposes
  • Sales, transactional, and logistics data that was originally collected by your company for the purposes of production and fulfillment
  • Social listening data collected from social networks, online comments, online reviews, blogs, and other user-generated website content.
  • Census research that was conducted by government sources to allocate funding and services throughout the local region or country
  • Academic research conducted at colleges and universities, whether it’s been published as a journal article or stuffed in a file drawer because the professor got interested in something else
  • Research conducted by competitors and presented at conferences or shared in blogs or industry magazines
  • Research conducted by industry associations among their members or their stakeholders
  • Research conducted by third-party groups for the sole purposes of selling for profit to other people (you!)
  • Data collected by internet search engines such as Google Trends


Some specific sources of secondary data that are often useful for consumer and market researchers include:


  • Acxiom – demographic, home, vehicle, shopping, interests data
  • Arbitron / Nielsen Audio – radio data
  • Comscore – website visits and behaviors, trends, digital/linear/OTT TV viewership
  • Datalogix – online click tracking, consumer lifestyles, demographics, audience data
  • Dunnhumby – customer data via retailer loyalty programs
  • ecommerceDB – traffic of major brands, business trends, revenue by country
  • Epsilon – demographic data
  • Equifax – financial data
  • ExactData – consumer and business names, postal, email addresses
  • IQvia – healthcare and pharmaceutical data, anonymous patient data
  • IRI – purchase, media, social, loyalty data, consumer, shopper, retail data
  • Mintel – new product launches by category
  • Numerator – retail purchases
  • SimilarWeb – websites traffic trends, sources


The key point is that someone else already generated or curated data to suit their own purposes and now you are taking advantage of it to make further analyses that suit your purposes.


No matter how innovative and ground breaking your research or business problem is, someone has ALWAYS done relevant research prior to you. For example, when the very first academic research examined the validity of online questionnaire data, lots of research had already been conducted to understand the validity of questionnaire data in general. No data exists in a silo!

.


Why use secondary research?

Let’s break secondary research into two overly simplified categories: Basic and complex.


Basic desk research

This is what you do everyday. It might take a few minutes or a few hours but you regularly:


  • Do quick online searches of the top 20 brands in a product category so that your questionnaire doesn’t exclude an important brand
  • Do a quick Twitter search to see the real words people use when they describe a brand so that you can build more informed focus group discussion guides
  • Check your government’s census data to ensure your questionnaire sampling plan is designed to reach a target group that reflects the general population in terms of gender, age, ethnicity, and income
  • Read an online blog post to gain a better understanding of a research methodology you don’t use very often (is this you right now?!)


Complex desk research

On the other hand, complex desk research might take weeks or months depending on how difficult it is find and analyze the information. For instance, developing a new product and introducing it to a new country with existing competitors would benefit from secondary research to address business problems such as:


  • What products already exist, what features do they offer, how are they priced?
  • What should your product cost given the prices and features of competitive brands and consumer characteristics?
  • How big is your market now and how big could it become?
  • How can your business identify the most strategic buyers and markets?
  • What do your suppliers and customers look like and which are the riskiest?
  • Which expansion strategies are effective in different parts of the country or the world?

.


Advantages of Secondary Research

There are disadvantages to every research methodology you might consider. For instance, with secondary research,  you won’t always find all the data you need, you’re not always sure about the detailed methodology behind the data collection and reporting, the data will never be complete nor perfect, and you won’t always get the why along with the what. But there are definitely some great advantages that come with triangulating multiple data sources to understand a specific problem.


Prove your worth

When launching a new product, it is important to prove to your boss, investors, and other stakeholders that your idea is worth investing in and you understand what is happening in the market. No idea exists in a vacuum and you need to demonstrate that you understand what your potential market looks like and what could go completely wrong (or completely right!) after you launch.


Avoid wasting time and money

Upon doing your research, you may discover that someone else has already built the amazingly innovative widget you were planning to build. You now have the opportunity to figure out how to differentiate yourself BEFORE wasting time building the exact same widget.


Decrease your margin of error

Why do researchers like large sample sizes? Because the more people you include in a research study, the more you improve your chances of finding the “correct” answer. As just one person, you can only conduct so much research. But, when you invest that time into collecting multiple pieces of research from multiple sources, you will improve your chances of finding the “correct” answer. In the academic world, you could think of this as meta-analysis – when 95 studies prove X and 5 studies prove Y, chances are the X is the “correct” answer.  (There often isn’t one correct answer, just a more comprehensive or well-informed answer.)

.


Tips to follow

Like many things, there is an art and a science to finding good quality data and analyzing it well. Here are some helpful tips to ensure you end up with useful secondary research:


Define clear research objectives

Just because you aren’t designing a questionnaire or interview doesn’t mean you can get away without well defined research objectives. Build a clear plan with specific research questions. Identify the types of data that could answer those questions – census data? Interview data? Sales data? It’s okay to start the research process with random searching in random places just to get a sense of what you know and don’t know. But, once you’ve used up that allotted discovery time, be specific and detailed about your next steps.


Create a framework for discovery

Rather than randomly looking for things, build a framework that will help you plan and organize. For example, “think, feel, do” is a  common framework. As you seek out information, look for data that helps you understand what people 1) think, 2) feel, and 3) do. Other frameworks might specify “buyers, brands, and businesses,” or “finances, logistics, and transactions,” or “design, field, analyze, report.” Focus on addressing the research problem from multiple angles – time frame, geography, target audience, metrics, and products. Whatever framework you build for yourself, it will help ensure that you cover all aspects of the business problem.


Seek a range of sources and data types

Look for government data, association data, academic data, newspaper data, and think tank data. Find qualitative and quantitative data, business and personal data, user and non-user data, customer and consumer data. Figure out all the types of places where your data could be and make sure it all gets a chance to be represented.


Don’t dismiss old data

Sales numbers, technology, and business processes might change quickly but human behavior changes soooo veeeeery slooooooowly. It’s often reasonable to skip over the technology part of older research – we don’t care about floppy disks, cathode ray tubes, and dot-matrix printers anymore. However, make sure to pay close attention to the human side of things. If people didn’t like something five years, their perceptions and emotions behind those dislikes could very well still be valid.


Seek out contradictions

It’s easy to find a set of data that offers conclusions you like and continue on the same path. But, that could lead you down one single path when there are actually multiple paths, all with enlightening and valid outcomes. That’s not to say you should entertain bad, wrong, or unethical ideas just because they are other ideas. Make sure you consciously seek out other ideas and actively reject them for good reasons rather than rejecting them because you didn’t know they existed.


Expect and confront bias

Try to identify potential sources of bias– age, gender, ethnicity, disability, sexuality, language, country, political, societal. You might not realize the bias there unless you specifically look for it. Once you’ve found it, then you can decide what to do about it. We’ve learned so much about bias in the last few years. This is your opportunity to stretch your new muscles.


Validate everything

Just because something is on the internet doesn’t mean it is good, right, or true. Heck, computers at the library are free to use, WordPress hands out blogs sites for free, and anyone can instantly create “The Authoritative Guide to Three Hour Questionnaires.” Unless that website was endorsed by ESOMAR, the Insights Association, and the Canadian Research Insights Council, I wouldn’t give it a nanosecond of my time.


Consider the Source: Who collected the data? Are they reputable? Do respected experts reference them? Do they treat those who disagree with them with respect? Do they point out the drawbacks, faults, and biases of their own research? Who complains about them in social media? Further, just because some data is created for the purposes of selling it for profit to multiple third parties doesn’t mean it’s biased… but it doesn’t inherently mean it’s trustworthy either.


Consider the Data: When was it collected? When was it published? How was the data checked for quality? What data might be missing or incomplete? Are key words specifically defined and not left to the imagination? Are the sample sizes appropriate to draw conclusions from? Is the sample reflective of the population it’s supposed to represent?


Include everything

When you’ve completed your thorough analysis, incorporate all of the data that led you to your final set of conclusions. This means including valid and trustworthy information that you agree with as well as valid and trustworthy data you disagree with. Share the entire set of information so that other people can come to their own conclusions too. If you’ve laid out your argument well, they should come to similar conclusions as you did.

..


What’s Next?

If you’ve got a simple secondary research project ahead of you, enjoy the process and leverage the time and money that someone else put into the research you’re benefiting from.

But, if you’ve got a complex and lengthy project ahead of you, our experienced desk researchers would be happy to help. Email your project specifications to our research experts using Bids at E2Eresearch dot com and we’ll lighten your load.


Learn from our case studies


Learn from our other blog posts

Tips for the First-Time Conjoint Analysis Researcher
By E2E Research | July 16, 2021

Researchers love conjoint analysis. It’s a handy statistical technique that uses survey data to understand which product features consumers value more and less, and which features they might be willing to pay more or less for.


It allows you understand how tweaks to combinations of features could increase desirability and, consequently, purchase price and purchase rate. Essentially, it asks, “Would you buy this product configuration if you saw it on the store shelf right now?”


Technically, there are numerous ways to present conjoint questions but all of them invite participants to compare two or more things. For example:


  • Would you rather buy this in red or yellow?
  • Would you rather pay $5 for a small one or $4 for a large one?
  • Would you rather buy this one or the competitive brand?
  • Would you rather buy this one or keep the one you already own?


The comparisons can get extremely complicated as you strive to create scenarios that mirror the complicated options of real life, in-store choices. This is because no two products are have the exact same features. There are always multiple tiny or major things different amongst them including brand, price, color, shape, size, functionality, etc.


As you see in the example conjoint question below, participants are being asked to select from among 5 different entertainment bundles, each with a different price and selection of options. Even though this question is nicely laid out, perhaps even nicer than what you might see in a store, it’s not a simple choice!


example conjoint analysis survey questions

.


Quick Conjoint Dictionary

First, let’s cover some quick terminology commonly used with the conjoint method so that the tips we will offer make sense.


  • Attribute: A characteristic of a product or service, e.g., size, shape, color, flavor, magnitude, volume, price.
  • Level: A specific measure of the attribute, e.g., red, orange, yellow, green, blue, and violet are levels of the attribute color.
  • Concept: An assembly of attributes and levels that reflect one product, e.g., a large bag of strawberry flavored, red, round candy for $4.99.
  • Set: A collection of concepts presented to a research participant to compare and choose from.
  • Simulator: An interactive, quantitative tool that uses the conjoint survey data to help you review consumer preferences and predict increases or decreases in market share based on potential product features and prices.

.


Conjoint Analysis Tips and Tricks

3 to 5: Across all attributes, levels, concepts, and sets, 3 to 5 is a good rule of thumb. With so many possible combinations of attributes, levels, and sets, the ask we’re making of participants could get overwhelmingly complicated and create a lot of cognitive fatigue. That’s why we suggest aiming for no more than 3 to 5 attributes, 3 to 5 levels per attribute, 3 to 5 concepts per set, and 3 to 5 sets. By ensuring that participants enjoy the process and can take the time to review each concept carefully, we can generate much better data quality.


Meaningful Levels: Choose attribute levels carefully. Do you really want to test 3 shades of blue or 3 flavors or apple? No. While you could choose price levels of $30, $32, and $34, they aren’t meaningfully different and wouldn’t create a lot of indecision on the store shelf. They wouldn’t create variation within your data. Try to include edge cases – options that are as far apart as you can make them while still being within the realm of possibility.


Be frugal with combinations: You already know there are combinations of attributes and levels you would never offer in-store so don’t waste people’s time and cognitive load testing them. Think carefully about which combinations of attributes and levels you would never offer together and exclude them from the test. For example, don’t waste your budget testing the least expensive price and the most expensive feature. Similarly, don’t test the value of adding an extra battery for a version of the product that doesn’t run on batteries.


Minimum number of shows: When testing a level, use it in at least 3 concepts for an individual person. Think of it in terms of a ruler – for quantitative metrics (e.g., price, length, volume, weight), you need to see whether the difference between Level 1 and Level 2 is perceived the same as the difference between Level 2 and Level 3.


magazines
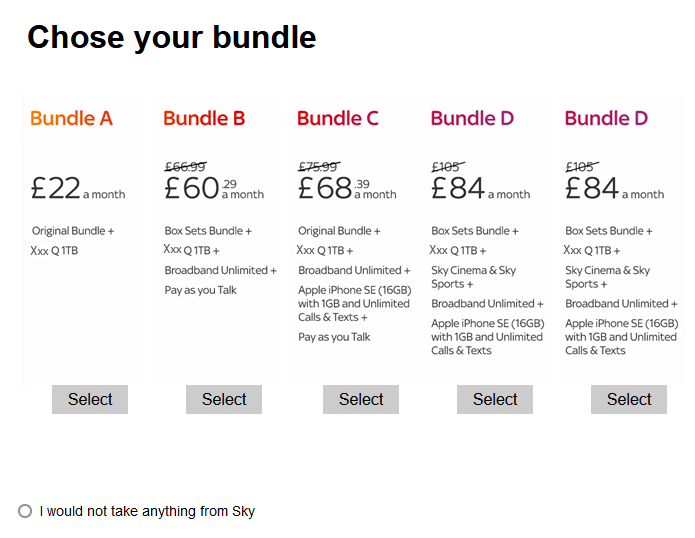
Include competitors: The real market includes competitors, often many. People don’t shop for single brands in isolation and neither should they answer your conjoint questions in isolation. Include at least one key competitor in your test, and preferably at least two. Further, if your brand is relatively unknown, you may wish to incorporate a competitor that is also relatively unknown.


Include an opt-out: Sometimes when you’re shopping, you discover they don’t have what you’re looking for and you leave the store empty handed. Generating realistic data means we must do the same in our simulated shopping trip – let people select “None of these” and leave without choosing anything. Otherwise, people may be “tricked” into selecting options they would never choose in real life.


Easy to read: Remember that conjoint is trying to simulate decisions that would normally happen in-store. Part of the in-store experience is in-store messaging. You’ll rarely see long sentences and paragraphs in the store so avoid them in your conjoint questions too. Use words and phrases that are as close as possible to what someone might see at the store.


cookiesUse imagery: We already know that a conjoint task can be cognitively demanding. That’s why imagery helps. Not only does it help people to visualize the product on the shelf amongst it’s competitive brands, it also helps to create a more visually appealing task (mmmmm cookies!). If you can’t provide an image of your product, find other ways to incorporate visuals in the questionnaire.


Plan for a hold-back sample: When product development work is extremely sensitive or is associated with life and death decisions, e.g., medical or pharmaceutical research, don’t let your budget determine the validity and rigor of your work. Spend the money to get the sample size you truly need to test each attribute and level with the appropriate rigor. And, build time into the fieldwork and data analysis schedule to permit preliminary analyses and test the model. You might need to tweak attributes, levels, or sets prior to running the full set of fieldwork.


Don’t let the statistics think for you: You wouldn’t create an entire marketing strategy based on gender differences just because a statistically significant t-test said 14% of women liked something and only 13% of men liked it. It’s not a meaningful difference. The same thing goes for a conjoint study. Review the model yourself, carefully, regardless of how “statistically significant” it is. Think about the various options suggested by the data. The simulator might reveal that there is a set of attributes and levels that would take over the market but that doesn’t mean you must produce that combination. The human brain is mightier than the spreadsheet!


If you’re curious to learn about the different types of conjoint that are available, this video from Sawtooth Software, presented by Aaron Hill, shares details about a few types of conjoint. E2E Research is pleased to offer all of these types to our clients.


What’s Next?

Are you ready to find out what configuration of your products and services consumers would be most keen to purchase? We’d be happy to help you work though the most suitable combinations of attributes and levels and build a conjoint study that meets your unique needs.


Please email your project specifications to our research experts using Projects at E2Eresearch dot com.


Learn more from our case studies


Learn more from our other blog posts

A Collision of Trust, Cobots, and AI Communications: Themes of the 2021 Collision Conference
By E2E Research | April 23, 2021

Collision 2021 was a four-day, North American tech conference that drew more than 38 000 attendees. I was fortunate to be one of those attendees this year thanks to a ticket kindly donated by ESOMAR. This year, the Collision Conference hosted more than 600 speakers from all walks of life. Just a few of those people included:


  • Celebrities: Cindy Crawford, Meaningful Beauty; Maria Sharapova, Therbody; Ashton Kutcher, Sound Ventures; Ryan Reynolds, Mint Mobile
  • CEOs and CMOs from global companies: Geoffrey Hinton, University of Toronto; Ukonwa Ojo, Amazon; Fiona Carter, Goldman Sachs; Martin Wildberger, Royal Bank of Canada
  • Local and global community leaders: Jagmeet Singh, Leader of Canadian New Democrat Party; John Tory, Mayor of Toronto; Katie Porter, Representative at US House of Representatives; Lori Lightfoot, Mayor of Chicago
  • And 13-year-old whiz kids whose expertise and speaking skills rivaled the most experienced speakers in attendance!


With hundreds of sessions running simultaneously (and literally colliding with each other!), it was easy to create a personalized stream of content, particularly since no matter the time, a great talk was always just beginning. The stream I created for myself focused on artificial intelligence, robotics, and innovation. Here are the key themes I took away.


Technology Leaders Must Prove Their Trust

People love their devices. We trust them to help us discover and buy products, make and take phone calls and text messages from our loved ones, and remind us about confidential meetings and doctor’s appointments. We trust our devices will work as expected when we need them to work. However, there is a trust problem and it doesn’t lie with the technology itself. It lies in the fact that we don’t trust the people behind our devices, neither the people building the devices nor our government leaders, to create and hold appropriate boundaries around privacy and security.


Companies build trust by having clear values and a clear mission grounded in being authentic, empathetic, transparent, and relatable. We learn to trust companies that shape our experiences in ways that are personalized but at the same time not creepy. We also learn who trust by witnessing which companies hold themselves fully and immediately accountable when they make mistakes. Companies that abuse these expectations will quickly find themselves speaking to a declining audience. A great way to think about trust is that every interaction a company has with a consumer is either a deposit or a withdrawal. You do good or you do bad. There is no neutral.


Robot, Cobots, and the Inevitable

Did you realize you already have robots in your home? If we follow the strict definition that any automatically operated machine that replaces people is a robot, then your electric toothbrush, your toaster, and your vacuum cleaner (even if it’s NOT a Roomba) are robots. We’re slowly getting used to the idea that robots don’t have to take a human shape to be called robots.


A newer take on robots is the idea of cobots. Unlike a lot of robots that run behind the scenes, collaborative robots are designed to interact directly with or next to people. While you may be nervous that robots or cobots will take your job, there are many good reasons to be excited about working with them. Not only do they easily take on jobs that are dull, dirty, and dangerous, they augment our skills and abilities and help us do our work better and with more agility. Robots make us physically stronger and mentally more agile. If we let them, they help us make truly better decisions.


As in the case of robots and cobots, if something is inevitable, get enthusiastic about it.


The Language of AI

One of the main complaints about artificial intelligence comes when it’s used as a substitute for people. For instance, researchers are actively working on building AI tools intended to serve as personal companions for people who are elderly or disabled, and counsellors for people who’ve experienced trauma. Isn’t that impersonal? Isn’t that disrespectful? Well, let’s consider it from a different angle.


Think about people who’ve experienced a life of trauma, a life wrecked by abuse, trafficking, trauma, or addiction. A life where people have repeatedly let them down and shown that they can’t be trusted. Those who’ve experienced trauma may find it particularly hard to trust new people and may be far more comfortable beginning their healing process by working with AI.


Think about people who have experienced a brain injury or deal with communication disabilities. Or people who aren’t using their native language. Or people who feel more comfortable communicating via email or text. We constantly hear that people should be treated in the way they want and prefer to be treated. That we need to increase accessibility. This could easily be AI.


Regardless of the initial need, we need to ensure that these AI communication tools demonstrate empathy and show respect. AI can’t replace human judgement but it can and should reflect good judgement.


What Does It Mean For Researchers

The research industry talks about trust all the time. We need research participants to trust us enough to share their most personal opinions, their most private click-paths, and their most unusual purchase behaviours. We need research tools that can effectively automate dull and error-prone research tasks leaving us with more time to do our jobs even better and make better decisions.


And we really need to focus on language. So much of our work revolves around language – writing questionnaires with respectful wording that everyone can understand, moderating focus groups that accommodate every participant, making the research space accessible to all.


I may not have attended a single market research talk but I did indeed come away with new perspectives that will make me rethink how I have conducted research in the past, and what I will do in the future.