The people researchers choose to share their opinions in marketing research can make a huge difference in the quality of answers we receive. That’s why it’s important to understand the research question and who would be best suited to speak with to get the necessary answers.
Let’s consider one type of sample that researchers often consider when conducting research – a census representative sample.
What is a census representative sample?
 You might also hear these referred to as ‘Census Rep’ samples. A census rep sample requires access to census data, something that is typically generated by large-scale government surveys completed by millions of their residents or citizens. In the USA, that’s census.gov and in Canada, that’s Statistics Canada.
A census rep sample can be designed to reflect any specific group of people. The key consideration is that the sample of completed questionnaires reflects the larger population on important criteria. The sample could reflect an entire country (e.g., USA, Mexica, Canada), a state or province (e.g., California, Quebec), or a city or town (e.g., Boston, Ottawa). This type of census rep sample is reasonably easy to define.
Another type of a census rep sample can be defined by target group behaviors or characteristics. For instance, you might be interested in a census rep sample of people who smoke or who have diabetes. Of course, building these types of census rep samples is far more difficult because government census data tends to be set up to understand basic demographics like age and gender, rather than behaviors like smoking and ailments like diabetes.
When would I use a census representative sample?
Census rep samples are extremely important for at least couple research objectives.
First, when you need to calculate incidence rates for a product or service, you need to first generalize from a representative group of people of your target audience. You need to be able to define your population before you can know what percent of them uses a product or performs a behavior.
Second, census rep samples are extremely important for market sizing. Again, you need to generalize from a representative group of your target audience before you can estimate the percent of people who might qualify to use your product or services.
Why is a census representative sample important?
 Creating a census representative sample is extremely important. You could get into trouble if you recruit a sample of research participants who don’t look like actual users.
You might gather opinions from too many older people, too many women, too many higher educated people, or too many lower income people. Your final research conclusion might be based on opinions collected from the wrong people and lead to development of the wrong product or product features.
An example of a census representative sample
Let’s consider an example where we want to determine which flavour of pasta sauce to launch in a new market – California. We’ve got two delicious options – a spicy, jalapeno version and a mild portobello mushroom version.
We know people from different cultures and ethnic backgrounds have very different flavor preferences so we need to ensure that the people who participate in our research will accurately reflect the region where we will launch this new pasta sauce.
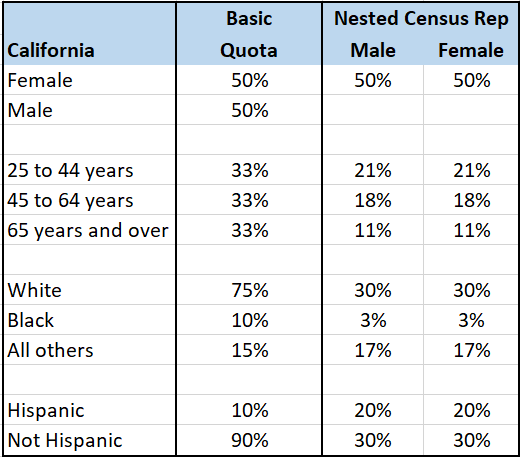
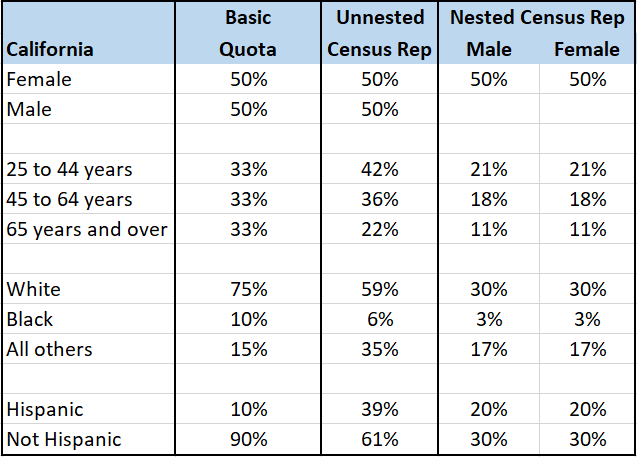
Now, we could recruit and survey a sample of people based on a basic quota that will help make sure we hear from a range of people. It might look like what you see in the first column of the table – even splits among each of the demographic groups with a bit of estimation for ethnic groups. But that’s not actually what California looks like. Instead, let’s build a census rep sample matrix based on real data.
 To start, we need to define a census rep sample of California. First, we find those people in a census dataset. Then, we identify the frequencies for each of the key demographic criteria – what is the gender, age, ethnicity, and Hispanic background (as well as any other important variables) of the people who live in California. Fortunately for us, this data is readily available. On the census.gov website, we learn that in California, 50% of people are female, 6% are Black, and 39% are Hispanic.
Now we can recruit a sample of people from California whose final data will match those demographic criteria – 50% female, 6% Black, and 39% Hispanic. You can see just how different those numbers are are from the original basic quotas!
In the last two columns, you can see that we’ve even split out the criteria by gender (even better, you can do this based on the census data). This will ensure that one of the age groups isn’t mostly women or one of the Hispanic groups isn’t mostly men. When we nest our criteria within gender, we end up with a nested, census rep sample. Nested demographics are the ideal scenario but they do make fulfilling sample more costly and time-consuming. You’ll have to run a cost-benefit analysis.
What’s Next?
Are you ready to build a census representative sample for your next incidence rate or market sizing project? Email your project specifications to our research experts using Projects at E2Eresearch dot com. We’d love to help you turn your enigmas into enlightenment!
Sample Conferences
- SampleCon: May 16 to 18, 2022
Learn more from our case studies
- Benchmarking Brand Awareness and Competitive Brand Space – A consumer food survey case study
- Choosing a Set of Flavors to Minimize Substitutions – A food survey + data analytics case study
- Creating a Beverage Launch Strategy in a Competitive Market – A beverage desk research case study
- Customer Behavioral Segmentation to Support Targeted Marketing – A BFSI data analytics case study