Request a quote!

Blog, News &

Case Studies

What is a Census Representative Sample?
By E2E Research | March 29, 2022

The people researchers choose to share their opinions in marketing research can make a huge difference in the quality of answers we receive. That’s why it’s important to understand the research question and who would be best suited to speak with to get the necessary answers.


Let’s consider one type of sample that researchers often consider when conducting research – a census representative sample.


What is a census representative sample?

Decorative imageYou might also hear these referred to as ‘Census Rep’ samples. A census rep sample requires access to census data, something that is typically generated by large-scale government surveys completed by millions of their residents or citizens. In the USA, that’s census.gov and in Canada, that’s Statistics Canada.


A census rep sample can be designed to reflect any specific group of people. The key consideration is that the sample of completed questionnaires reflects the larger population on important criteria. The sample could reflect an entire country (e.g., USA, Mexica, Canada), a state or province (e.g., California, Quebec), or a city or town (e.g., Boston, Ottawa). This type of census rep sample is reasonably easy to define.


Another type of a census rep sample can be defined by target group behaviors or characteristics. For instance, you might be interested in a census rep sample of people who smoke or who have diabetes. Of course, building these types of census rep samples is far more difficult because government census data tends to be set up to understand basic demographics like age and gender, rather than behaviors like smoking and ailments like diabetes.


When would I use a census representative sample?

Census rep samples are extremely important for at least couple research objectives.


First, when you need to calculate incidence rates for a product or service, you need to first generalize from a representative group of people of your target audience. You need to be able to define your population before you can know what percent of them uses a product or performs a behavior.


Second, census rep samples are extremely important for market sizing. Again, you need to generalize from a representative group of your target audience before you can estimate the percent of people who might qualify to use your product or services.


Why is a census representative sample important?

Decorative imageCreating a census representative sample is extremely important. You could get into trouble if you recruit a sample of research participants who don’t look like actual users.


You might gather opinions from too many older people, too many women, too many higher educated people, or too many lower income people. Your final research conclusion might be based on opinions collected from the wrong people and lead to development of the wrong product or product features.


An example of a census representative sample

Let’s consider an example where we want to determine which flavour of pasta sauce to launch in a new market – California. We’ve got two delicious options – a spicy, jalapeno version and a mild portobello mushroom version.


We know people from different cultures and ethnic backgrounds have very different flavor preferences so we need to ensure that the people who participate in our research will accurately reflect the region where we will launch this new pasta sauce.


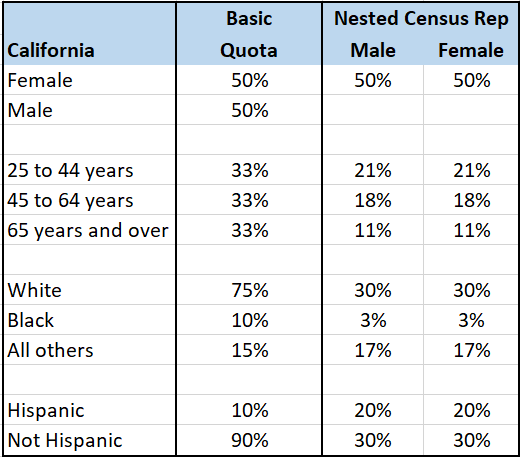
Now, we could recruit and survey a sample of people based on a basic quota that will help make sure we hear from a range of people. It might look like what you see in the first column of the table – even splits among each of the demographic groups with a bit of estimation for ethnic groups. But that’s not actually what California looks like. Instead, let’s build a census rep sample matrix based on real data.


Decorative image 
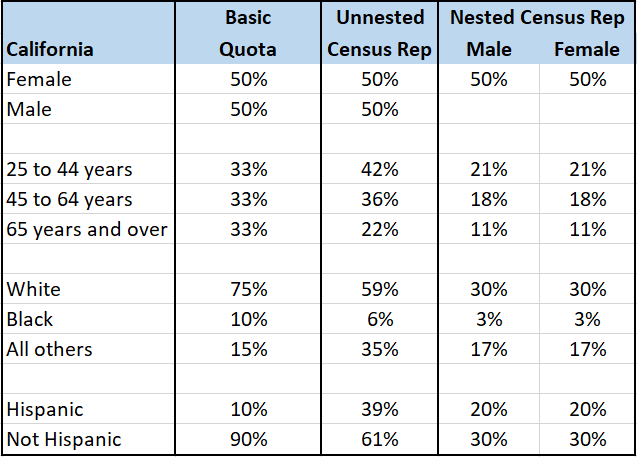
To start, we need to define a census rep sample of California. First, we find those people in a census dataset. Then, we identify the frequencies for each of the key demographic criteria – what is the gender, age, ethnicity, and Hispanic background (as well as any other important variables) of the people who live in California. Fortunately for us, this data is readily available. On the census.gov website, we learn that in California, 50% of people are female, 6% are Black, and 39% are Hispanic.


Now we can recruit a sample of people from California whose final data will match those demographic criteria – 50% female, 6% Black, and 39% Hispanic. You can see just how different those numbers are are from the original basic quotas!


In the last two columns, you can see that we’ve even split out the criteria by gender (even better, you can do this based on the census data). This will ensure that one of the age groups isn’t mostly women or one of the Hispanic groups isn’t mostly men. When we nest our criteria within gender, we end up with a nested, census rep sample. Nested demographics are the ideal scenario but they do make fulfilling sample more costly and time-consuming. You’ll have to run a cost-benefit analysis.


What’s Next?

Are you ready to build a census representative sample for your next incidence rate or market sizing project? Email your project specifications to our research experts using Projects at E2Eresearch dot com. We’d love to help you turn your enigmas into enlightenment!


Sample Conferences


Learn more from our case studies


Learn more from our other blog posts
From Digital Fingerprinting to Data Validation: Techniques to Facilitate the Collection of High Quality Market Research Data
By E2E Research | August 19, 2021

In the market and consumer research space, there is good data and bad data.


Good data comes from research participants who try to do a good job sharing their thoughts, feelings, opinions, and behaviors. They might forget or exaggerate a few things, as all people do every day, but they’re coming from a good place and want to be helpful. In general, most people participating in market research fall into this category. They’re regular, every day people behaving in regular every day ways.


Bad data comes from several places.


First, sometimes it comes from people who are just having a tough day – the kids need extra attention, the car broke down, their credit card was compromised. Some days, people aren’t in a good frame of mind and it shows in their data. That’s okay. We understand.


Second, rarely, bad data comes from mal-intentioned people. Those who will say or do anything to receive the promised incentive.


Third, very often, it comes from researchers. Questionnaires, sample designs, research designs, and data analyses are never perfect. Researchers are people too! We regularly make mistakes with question logic, question wording, sample targeting, scripting and more but we always try to learn for the next time.


In order to prevent bad data from affecting the validity and reliability of our research conclusions and recommendations, we need to employ a number of strategies to find as many kinds of bad quality data as possible. Buckle up because there are lots!


Data Validation

What is data validation?

Data validation is the process of checking scripting and incoming data to ensure the data will look how you expect it to look. It can be done with automated systems or manually, and ideally using both methods.


What types of bad data does data validation catch?

Data validation catches errors in questionnaire logic. Sometimes those errors are simply scripting errors that direct participants through the wrong sequence of questions. Other times, it’s unanticipated consequences of question logic that means some questions are accidentally not offered to participants. These problems can lead to wrong incidence rates and worse!


How do data validation tools help market researchers?

Automated systems based on a soft-launch of the survey speed up the identification of survey question logic that leads to wrong ends or dead ends. Manual systems help identify unanticipated consequences of people behaving like real, irrational, and fallible people.


Automated tools can often be integrate with your online survey platforms via APIs. They can offer real-time assessments of individual records over a wide range of question types, and can create and export log files and reports. As such, you can report poor quality data back to the sample supplier so they can track which participants consistently provide poor quality data. With better reporting systems, all research buyers end up with better data in the long run.


Digital Fingerprinting

What is digital fingerprinting

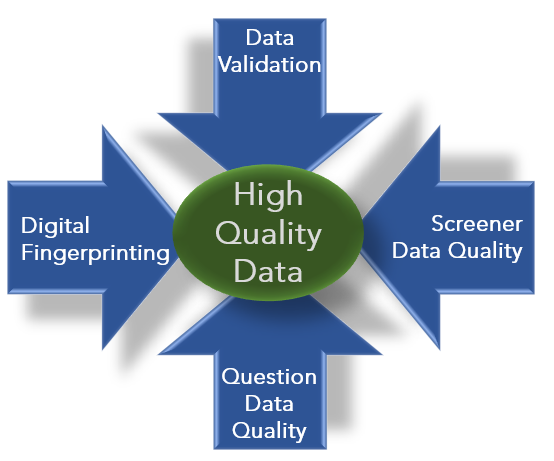
Digital fingerprinting identifies multiple characteristics of a research participant’s digital device to create a unique “fingerprint.” When enough different characteristics are gathered, it can uniquely identify every device. This fingerprint can be composed of a wide range of information such as: browser, browser extensions, geography, domain, fonts, cookies, operating system, language, keyboard layout, accelerator sensors, proximity sensors, HTTP attributes, and CPU class.


What types of bad data does digital fingerprinting catch?

  • Digital fingerprinting helps identify data from good-intentioned people who answer the same survey twice because they were sent two invitations. This can easily happen when sample is acquired from more than one source. They aren’t cheating. They’re just doing what they’ve been asked to do. And yes, their data might be slightly different in each version of the questionnaire they answered. As we’ve already seen, that’s because people get tired, bored, and can easily change their minds or rethink their opinions.
  • Digital fingerprinting also helps identify data from bad-intentioned people who try to circumvent processes to answer the same survey more than once so they can receive multiple incentives. This is the data we REALLY want to identify and remove.


How do digital fingerprinting tools help market researchers?

Many digital fingerprinting tools are specifically designed to meet the needs of market researchers. They’re especially important when you’re using multiple sample sources to gather a large enough sample size. With these tools, you can:


  • Integrate them with whatever online survey scripting platform you regularly use, e.g., Confirmit, Decipher, Qualtrics
  • Identify what survey and digital device behaviors constitute poor quality data
  • Customize pass/fail algorithms for any project or client
  • Identify and block duplicate participants
  • Identify and block sources that regularly provide poor quality data


Screener Data Quality

In addition to basic data quality, researchers need to ensure they’re getting data from the most relevant people. That includes making sure you hear from a wide range of people who meet your target criteria.


First, rely more than the key targeting criteria – e.g., Primary Grocery Shoppers (PGS). Over-reliance on one criteria could mean you only listen to women aged 25 to 34 who live in New Jersey.


By also screening for additional demographic questions, you’ll be sure to hear from a wide range of people and avoid some bias. For PGS, you might wish to ensure that at least 20% of your participants are men, at least 10% come from each of the four regions of the USA, and at least 10% come from each of four age groups. Be aware of what the census representative targets are and align each project with those targets in a way that makes sense.


Second, avoid binary screening questions. It may be easy to ask, “Do you live in Canada,” or “Do you buy whole wheat bread.” However, yes/no questions make it very easy to figure out what the “correct” answer is to qualify for the incentive. Offer “Canada” along with three other English-speaking nations and “Whole wheat bread” along with three other grocery store products. This will help ensure you listen to people who really do qualify.


Survey Question Data Quality

Once participants are past the screener, the quest for great data quality is not complete. Especially with “boring” research topics (it might not be boring for you but many topics are definitely boring for participants!), people can become disengaged, tired, or distracted.


Researchers need to continue checking for quality throughout the survey, from end to end. We can do this by employing a few more question quality techniques. If people miss on one of these metrics, it’s probably ok. They’re just being people. But if they miss on several of these, they’re probably not having a good day today and their data might be best ignored for this project. Here are three techniques to consider:


  • Red herrings: When you’re building a list of brands, make sure to include a few made-up brands. If someone selects all of the fake brands, you know they’re not reading carefully – at least not today.
  • Low/high incidence: When you’re building a list of product categories, include a couple of extremely common categories (e.g., toothpaste, bread, shoes) and a couple of rare categories (e.g., raspberry juice, walnut milk, silk slippers). If someone doesn’t select ANY of the common categories or if they select ALL of the rare categories, you know they’re not reading carefully – at least not today.
  • Speeding: The data quality metric we love to use! Remember there is no single correct way to measure speeding. And, remember that some people read extremely quickly and have extremely fast internet connections. Just because someone answers a 15 minute questionnaire in 7 minutes doesn’t necessarily mean they’re providing poor quality data. We need to see multiple errors in multiple places to know they aren’t having a good day today.


And of course, if you can, be sure to employ more interesting survey questions that help people maintain their attention. Use heatmaps, bucket fills, gamification, and other engaging questions that people will actually want to answer. A fun survey is an answered survey, and an answered survey is generalizability!

——————————————————–


What’s Next?

Every researcher cares about data quality. This is how we generate valid and reliable insights that lead to actionable conclusions and recommendations. The best thing you can do is ask your survey scripting team about their data validation and digital fingerprinting processes. Make sure they can identify and remove duplicate responders. And, do a careful review of your questionnaire to ensure your screener and data quality questions are well written and effective. Quality always starts with the researcher, with you!


If you’d like to learn how we can help you generate the best quality data and actionable insights, email your project specifications to our research experts using Projects at E2Eresearch dot com. We’d love to help you grow your business!


Learn more from our other blog posts

5 Ways to Protect Your Market and Consumer Research Sample Investment
By E2E Research | April 17, 2021

It isn’t cheap to gain access to people to participate in research studies. It’s a necessary investment that researchers make so they can listen to and understand a carefully targeted set of people. In order to discover high quality, generalizable insights that can be converted into actionable outcomes, this investment needs to be protected. Here are five techniques you can use to protect your investment.


Digital Fingerprinting


In the research space, digital fingerprinting is used for two key reasons (though others exist). It can help prevent people from participating in a research project more than once, whether by accident or on purpose. And, it can also ensure that participants originate from the country we expect them to be in. Catching inappropriate participants early in the process helps keep research costs lower as we won’t end up paying for invalid completes. And, by preventing duplicate responses, validity and reliability of results are improved.


Digital fingerprinting happens behind the scenes automatically. It involves identifying a range of features on an individual’s computer or mobile device to create a unique, data-driven identifier. Features could include computer specifications such as operating systems, installed software, browsers, geography, domains, and ISPs.


Early Data Validation


There’s no such thing as a perfect questionnaire. Building questionnaires is a subjective process that incorporates both art and science. Even for experts, it’s a cumbersome and complicated task to ensure that every skip and logic criteria is correct and creates the desired flow for every single participant. Fortunately, we can save time and increase data quality by leveraging digital tools designed for early data validation.


As always, every questionnaire should be manually checked for logic errors. On top of that, early data validation tools can confirm the accuracy or identify logic errors during soft launches. Catching oddities early will permit revisions or fixes to be made in the questionnaire or the scripting before the entire sample receives a less than ideal questionnaire.


Increased Consistency


When research objectives require targeting a hard-to-reach sample of people, we might need to access participants from several sources. Multiple sources, multiple processes, multiple email systems…. that’s a recipe for confusion and error.


As researchers, we know that consistency is key – when participants receive different messages at different times and with different formatting, this can have a negative impact on the research results. If it’s a struggle to stay organized and maintain consistency with samples using disparate systems, take advantage of a Survey Link Management system.


Re-Screening

Re-screening is a tricky topic. Most panels screen their panelists at least annually on key demographic variables like age, gender, and region. However, people move from state to state, get married or divorced, have children, and change and lose jobs and income. And, it’s now becoming more common for people to feel comfortable about sharing a gender identity that isn’t what they previously shared.


As much as we want to make surveys shorter for panelists, we also need to recognize that people’s lives are bumpy roads. People change.


It’s always a good idea to re-screen potential participants on at least few key variables to ensure your investment still reflects the people you need to speak with.


Engaging Questionnaires

When online surveys first became available twenty years ago, researchers got excited about radio buttons, check boxes, and text boxes. Fast forward to today… and researchers are less excited but still focused on radio buttons and check boxes.


Think for a minute about the digital activities people love to spend time on today. Those games and social networks have no radio buttons or check boxes. They use drag and drop, flicking, and swiping. They’re filled with images, sounds, and video. They’re fun and entertaining.


Surveys could be like that too. If we want to ensure the people we’ve invited to complete our surveys actually follow through and complete those surveys, we need to create a research experience that encourages engagement. We need to take advantage of the advanced participant engagement tools that are available to us today. Let’s write questionnaires that look like they were built this year.


E2E Engame question animationE2E Engame question animationE2E Engame question animation


.

In Conclusion

It takes a lot of expertise to curate customized solutions that fit specific research needs. When we put the time into curating a targeted group of participants, our investment needs to be protected by building participant engagement and data quality techniques into the survey process. This is how we will generate better quality outcomes and smarter business decisions.


If you’re ready to build a research study with great data quality, please feel free to email your project specifications to our research experts using Bids at E2Eresearch dot com.


Review our case studies


Sample Conferences