Request a quote!

Blog, News &

Case Studies

A Beginner’s Guide to Usage and Attitude Studies
By E2E Research | January 11, 2023

Ah, a rose by any other name smells just as sweet! Roses? Well, instead of using the phrase Usage and Attitude, you might hear some people use the phrase Habits and Practices. And instead of shortening it down to U&A, they’ll shorten it down to H&P. Whether you’re interested in a U&A or an H&P, we’re generally talking about the same thing. Use the acronym you prefer and we’ll all gain more valuable insights into consumer behavior, attitudes, and usage patterns.


What is a Usage and Attitude Study?

Decorative imageUsage and Attitudes studies aim to understand a broad range of behaviors and attitudes related to the people experiencing a product or service. It’s relevant for all products like food, beverages, hair care, and electronics, as well as services like healthcare, banking, and education.


Most U&As gather information about the brand of interest, as well as competitive brands and the category as a whole. This ensures you gain a full understanding of any behaviors and attitudes that could eventually be relevant and important to the brand of interest.


Why is a Usage and Attitude Study Important?

U&As create a solid foundation for building a brand. They serve a number of important benefits in a variety of key areas.


People: Know your buyer and your consumer
  • Create more relevant and memorable messaging by understanding the unique demographic and psychographic characteristics of each segment of users that has been identified in any segmentation research you’ve conducted
  • Understand purchase drivers associated with each persona, e.g., price, availability, loyalty, packaging, sensory features, sustainability, durability
  • Plan for the future by identifying what each segment needs and wants from an ideal product
  • Differentiate between the needs of buyers (e.g., availability, pricing) and users (e.g., efficacy, sensation), and ensure the targeted message reaches each audience


Place: Know your buyers’ preferred information and purchase channels
  • Focus your marketing spend in the most effective channels by identifying the marketing and sales channels and influencers that are most effective and important at each stage of the purchase journey


Pricing: Know your buyers’ preferred pricing models
  • Create the most effective pricing model by understanding attitudes towards various pricing strategies, e.g., every day low pricing vs sales vs bundling


Promotion: Know your buyers’ preferred promotion tactics
  • Create the most effective promotion model by understanding which types of promotions are relevant for your buyers, e.g., in-store promotions, OOH promotions, door-to-door promotions


Product: Know what your consumer needs and wants from your product
  • Prevent switching and abandonment by identifying and resolving frustrations, complaints, and pain points
  • Encourage purchase by identifying and reminding people of desired benefits and advantages
  • Plan product improvements by understanding which product features people love and hate


Strategy: Know how to position and plan for the future

Decorative image


What Questions to Ask in a Usage and Attitude Study

Decorative imageAs with any research project, there is an unlimited number of questions that could be asked. The key is to identify the specific research objectives for the imminent research project and focus the questions there.


Then, select a set of engaging questions that will keep the entire questionnaire to less than 15 minutes long. Don’t try to do everything or the data quality will suffer.


Brand Metrics
  • Awareness: When you think of this product category, which brands come to mind first?
  • Aided Awareness: From this list of brands, which ones have you heard of?
  • Discovery: How did you first hear about this brand?
  • Trial: Which brands of this category have you ever tried?
  • Trial: Why did you decide to try this brand?
  • Consideration: When you think of this product category, which brands would you consider buying?
  • Consideration: From this list of brands, which ones would you considering buying?
  • Preference: When you think of this product category, which brand do you most prefer?
  • Loyalty: If your preferred brand was not available in your usual store, what would you do?
  • Perceptions: Which 5 of these words reflect your opinions about this brand?
  • Perceptions: What 3 things do you like about this brand? What 3 things do you dislike about this brand?
  • Perceptions: Which of these brands is most innovative? Fun? Likeable? Effective? Appealing? Different?
  • Perceptions: What is your opinion about the effectiveness of this brand? Quality? Appearance? Texture? Taste? Scent? Sound? Durability? Sustainability?
  • Perceptions: Overall, what is your opinion about this brand?


Product Usage
  • In your household, which of these people use this category?
  • In your household, who uses this category most often?
  • Where in your home is this category used?
  • At what time of day/week/month/year is this category used?
  • How is this category used?
  • What occasions is this category used for? Every day? Holidays? Religious days? Birthdays?
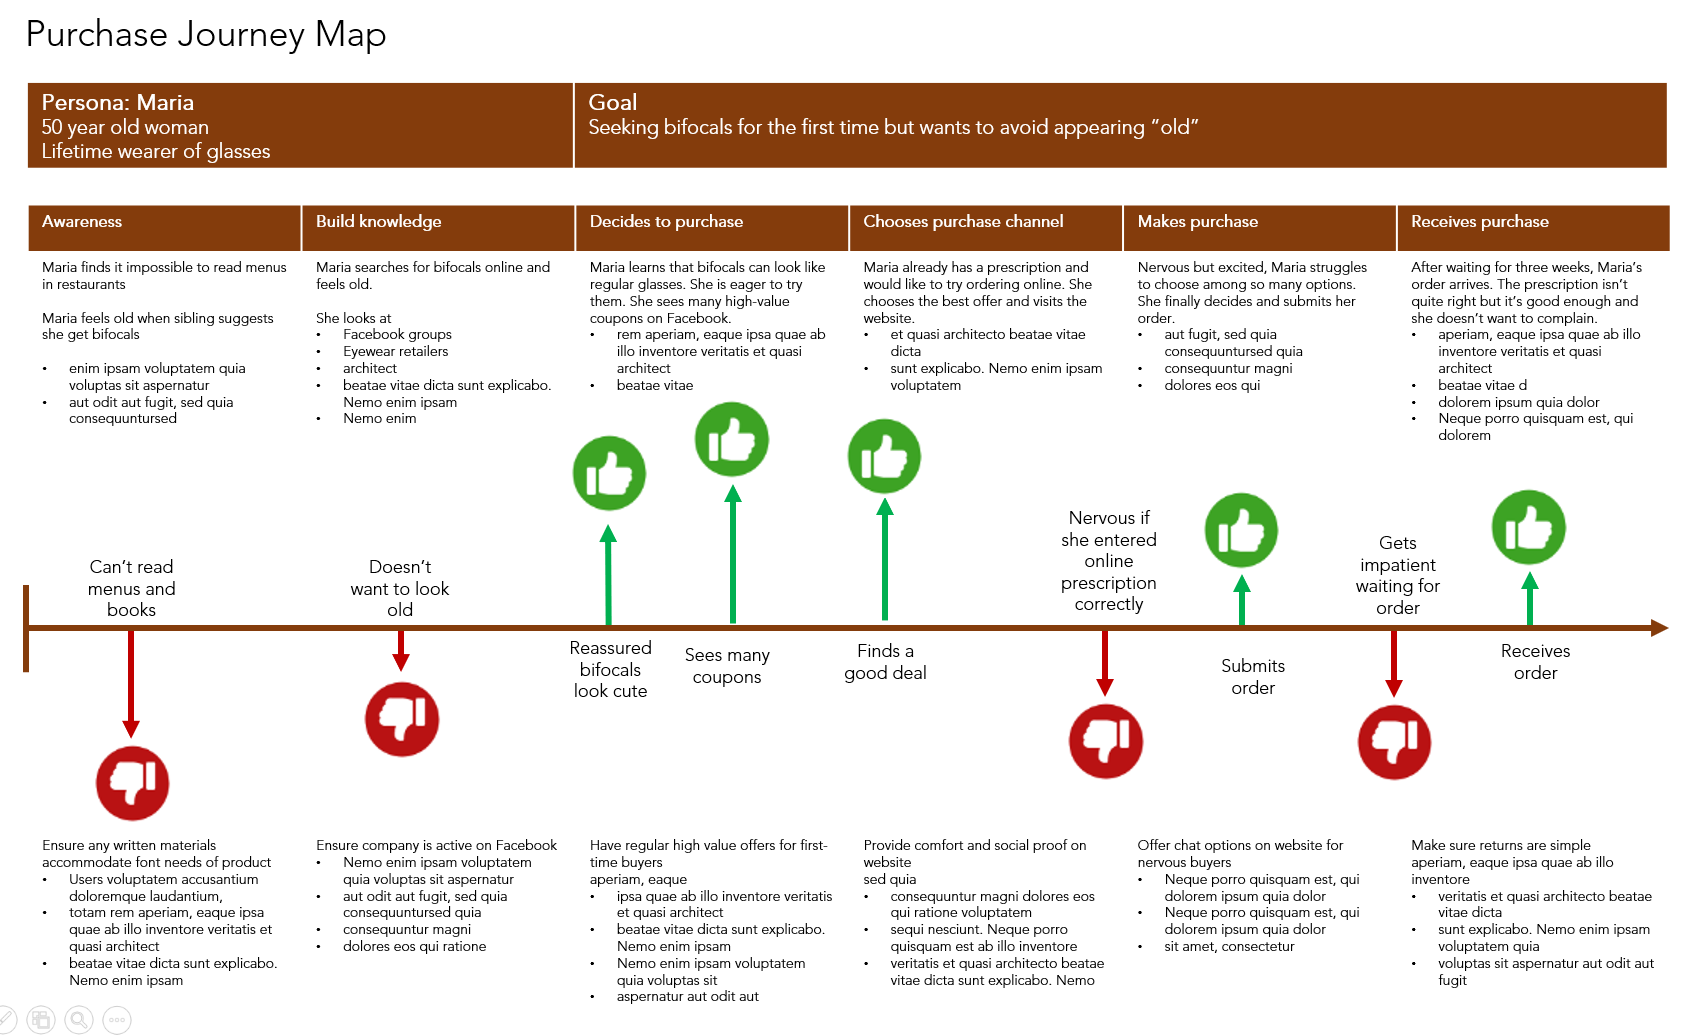


Decorative imagePurchase Journey:
  • Who usually buys the product?
  • What are all the places where this category/brand is bought?
  • Where is this category/brand usually bought?
  • Where do you prefer to buy this category?
  • On the next shopping trip, which brands will be bought?


Purchase Frequency / Recency / Monetary
  • How often is each of these brands bought?
  • How often is each of these brands used?
  • In just the last 7 days, which of these brands have been bought?
  • When was the last time each of these brands have been bought?
  • What size package of category/brand is usually bought? What size is preferred?
  • At what time of the day/week/month/year is this brand/category usually bought?
  • The last time this category/brand was bought, about how much was spent on it?
  • The last time this category/brand was bought, were any coupons or cost savings used?
  • What is your opinion about using coupons? Buying at regular price? BOGOs?


Personal Details
  • Demographics: Age, gender, income, education, ethnicity, religion, household size, children in home
  • Psychographics: Personal attitudes towards relevant category characteristics, e.g., sustainability, early adoption, pricing preferences


Why Ask About Behaviors that Can Be Measured Digitally?


Decorative imageIf time and money were no objectives, many metrics could be confirmed visually or digitally. Sometimes, however, it’s faster and easier to just ask people. Sometimes the data isn’t available in a properly formatted, readable database. Sometimes the data isn’t available for purchase. And sometimes, we need to match attitude data with behavior data for specific people.


Or, and this is much more interesting, maybe we want to understand what people think they are doing. The way people think about or recall their behaviors is an indirect measure of awareness, loyalty, believability, and likeability. If people can’t remember which brand they buy, whether the name or the logo, that’s not a great indicator of brand loyalty which could permit a premium pricing strategy.


What’s Next?

Most brands are well served to conduct a U&A study. If you’re ready to discover top quality insights about your buyers, brands, and business, email your project specifications to our research experts using Projects at E2Eresearch dot com. We’d love to help you turn your enigmas into enlightenment!


Learn more from our case studies


Learn more from our other blog posts


A Practical Guide to Ad Concept Testing
By E2E Research | January 4, 2023

You love your ad concept but does your target audience love it?


Advertising is an omnipresent tool that both small and large brands depend on to build and sustain their business growth. But, if your target audience doesn’t like your ads, you won’t be able to achieve the increased brand recall, awareness, purchase, and repurchase rates you were hoping for.


By asking people for feedback about potential ads prior to launching those ads, it’s possible to understand how people perceive them and how they will act as a result of experiencing them.


What are the benefits of ad testing?

Of course ad testing is fun to do but there are important benefits to conducting this research.


Safeguard your brand reputation. Rather than launching an ad that annoys or offends large segments of the viewing audience, conduct ad testing to find and fix unexpected surprises before they become problems in the broader market. Keep in mind that, sometimes, things that are ‘offensive’ to customers or consumers are your deliberate choices and won’t be changed. Either way, ad testing will help ensure the brand is represented as intended.


Use marketing budget wisely. Though conducting ad testing can seem expensive, the potential cost of a failed ad can be vastly higher. Ad testing ensures that ineffective ads are identified and improved before they are launched in-market so that they will generate the awareness or trial as intended. Further, ad testing will help identify in which channels an ad will be most effective. Finding the channel that is appropriate for an ad is just as important as creating a great ad.


Make a good ad great. As one brand among millions, every brand faces fierce competition. Most people see thousands of ads every single day so it’s important to ensure your ad stands out and is memorable in a positive way. Ad testing prior to market launch creates an opportunity to make small or large adjustments so that good ads are even better. Listen to and act on the perceptions of research participants even when they already like an ad. If likeability, uniqueness, or believability could be better, tweak the appropriate components of the ad to improve those metrics.


Understand customer personas. Even great ads are not liked by everyone. Use ad testing to identify which personas prefer which ads so that ads can be presented to the right people in the right channel. If you’ve done segmentation research already, you’ve probably identified 2 or 3 personas that you’ll want your ads to resonate with and you can focus your efforts there.


Make data-driven decisions. Sometimes, multiple ad concepts will seem promising and a clear winner can’t be identified. Ad testing takes the guesswork and personal biases out of choosing a winning ad. And, getting formal approval to run an ad with a big budget is much easier when the data supports the final ad choice.


What research design does ad testing use?

There is no single correct method for conducting an ad test but most use one of three methods, each of which have unique advantages and disadvantages.


Decorative image
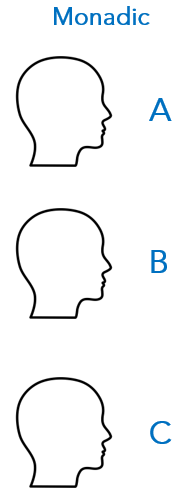
Monadic Tests: In this research design, each participant experiences and rates just one ad.

  • No order effects. Because people only see one ad, there is no risk that viewing one ad concept before another will have a negative or positive impact on perceptions of the subsequent ad.
  • More in-depth results. Because each person spends all their time considering only one ad, you may have the opportunity to ask more in-depth questions about that ad. Alternatively, the questionnaire could remain shorter thereby maintaining engagement throughout the testing period and increasing completion rates.
  • Larger sample sizes. You may need a larger sample size to generate reliable data. For example, you might need to sample 300 people for each of 3 ads for a total of 900 people. This could cost a lot more, particularly if your target audience is hard to reach.
  • Match group demographics. You will need to ensure that each group is matched on key demographics. For example, you wouldn’t want to discover after the fact that mostly women experienced ad #1 and mostly men experienced ad #2 such that the results actually reflect a gender difference, not an ad creative difference.


Decorative image
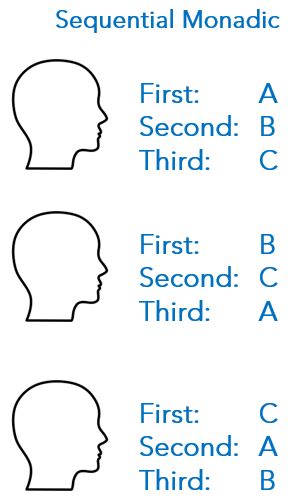
Sequential Monadic Tests: Research participants experience and rate several ads individually.

  • Smaller sample size: In general, the more concepts each person reviews, the smaller your sample size can be. This is advantageous especially when you must test many ads, and even if each participant only reviews 2 or 3 of those ads. For example, if you’re testing 3 ads and each person sees all 3 ads, you might need only 300 research participants.
  • No need to match groups. Because people review several ads, each person acts as their own control group. For the most part, this eliminates the need to precisely match groups based on demographic or psychographic characteristics. This makes sampling much easier and potentially much quicker.
  • Order bias must be prevented: To prevent order bias, you’ll need to randomly assign ads to each person, and you’ll need to randomly assign the order in which those ads are presented to each person. For example, if there are 4 ads to review, person 1 might review ads A B and C, person 2 could review ads B D and A, person 3 could review ads D C and E, person 4 could review ads C E and D, and person 5 could review ads E A and B. Order bias will still occur but it will be averaged across all of the ads reducing the potential impact on any one ad.
  • Longer questionnaire: Because multiple ads must be reviewed by each person in one questionnaire, it may take longer for them to complete and may result in lower completion rates. Do your best to limit the number of ads each person experiences to no more than 3. And, do your best to keep the completion length under 15 minutes.


Decorative image
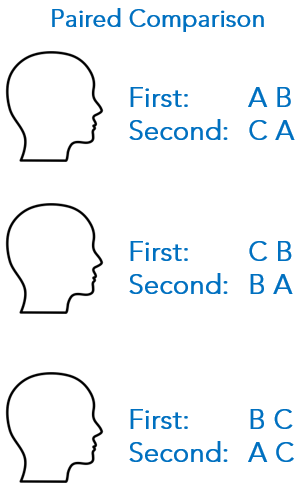
Paired Comparison Tests: Rather than showing ads consecutively as in the sequential monadic design, this method has participants experience and rate two or more ads at the same time.

  • Smaller sample size: As with the sequential monadic test, having each participant rate multiple ads means you can use a smaller sample size. If you can keep the questionnaire short, this could result in a less expensive project.
  • Order effects are reduced. Because people see multiple ads together, the risk of order effects is reduced. Any single ad simply has to be stronger than its competitive ad. Ideally, ads should still be randomly assigned to sets, and sets should be randomly assigned an order.
  • Comparisons create cognitive load. Participants may find they like different features of the ads presented to them and consequently struggle to choose one preferred ad. This can cause fatigue, and decrease engagement and attention.
  • Longer questionnaire: As before, asking people to rate multiple ads may result in a longer questionnaire. To maintain engagement and completion, you’ll need to take care to ensure the questionnaire is no longer than 15 minutes. You can also help maintain engagement by ensuring you use engaging question types.


What are the key metrics for ad testing?

You could ask each person hundreds of questions about the presentation, messaging, and branding of an ad but you’d end up with a two-hour questionnaire and an unnecessarily low completion rate. Instead, identify the key goals of the ad and choose a set of 3 to 5 key questions that directly address those goals. Then, create a secondary set of questions that will support your KPIs and help you identify points of strength or weakness.


Potential questions could reflect a range of categories such as the following.


Questions about the ad overall
E2E Engame question animation

  • Overall, what is your opinion about the ad?
  • How believable is the ad?
  • How relevant is the ad to you personally?
  • How appealing is the ad?
  • How memorable is the ad?
  • Compared to other ads about similar kinds of products, how different is this ad?
  • How genuine is this ad?
  • What 3 things do you like about the ad?
  • What 3 things do you dislike about the ad?


Questions about the presentation of the ad
E2E Engame question animation

  • What is your opinion about the images used in the ad?
  • What is your opinion about the videos used in the ad?
  • What is your opinion about the music and sound used in the ad?
  • What is your opinion about the spokesperson / mascot in the ad?
  • How well does the ad fit into the Facebook environment? Instagram? TikTok? Snapchat?


Questions about the messaging
E2E Engame question animation

  • What is the main message of the ad?
  • How clear was the main message of this ad?
  • How did the message make you feel?
  • Did you learn anything new from this ad?
  • What 2 things did you like about the message?
  • What 2 things did you NOT like about the message?
  • Which 3 of these words describe how you feel about the message?
  • What did the message NOT address even though it should have?


Questions about the brand
E2E Engame question animation

  • How likely are you to buy this product?
  • How likely are you to recommend this product to your family or friends?
  • How likely are you to visit the website / download the app / connect on Facebook / enter the draw?
  • How much do you care about the brand?
  • Did the ad change how you care about the brand?
  • Did the ad change how you think about the brand?


How to conduct an ad test


  1. Identify campaign objectives: Rather than simply entertain, most ads attempt to teach, persuade, or invoke a behavior. For example, teach someone about a product feature, persuade them that a product can meet their needs, or cause them to buy something. Be specific, clear, and realistic about what you expect  your ad to achieve.


  1. Identify the target audience: Consider who you intend to target the ad to. Will it be a broad message intended to resonate with a broad range of people, or a very specific message for specific segments or personas? Have a clear idea about the demographics and psychographics of the audience you intend to appeal to. At the same time, you’ll need to confirm that you can actually reach a representative sample of this audience with your ad. If you can’t reach this audience, you’ll need to identify either a new target group or a new channel.

.

  1. Identify the key metrics. With the campaign objectives in mind, identify the most important questions that will serve as metrics – your Key Performance Indicators or KPIs. If you’re aiming to build awareness, you’ll want to focus on brand recall. If you’re aiming to invoke a behavior, you’ll want to focus on your call to action, whether that’s purchase intent, connecting on social media, or some other behavior.


  1. Identify success measures. Once you have your KPIs in hand, you can identify the success measures. This could be to generate purchase intent rates over 50%, brand awareness over 90%, or consideration over 60%. Also, make sure to identify specific criteria for how to differentiate ads that perform similarly. Tie-breaking criteria may relate to superior clarity or believability scores. It’s important to identify your success measures prior to running the test to ensure you stick to your principles of what true success really is.


  1. Identify the sample size. Once you know how many target audiences you’re addressing and how many ads you’ll be testing, you can determine an appropriate sample size. Remember, the more segments that will be targeted, the larger the sample size will need to be. For a trustworthy outcome, aim for at least 300 people in each segment to review each ad.


  1. Decide what to test. Ad testing is never an all or nothing decision. Testing could address:
  • Several versions of the same ad or several completely different ads
  • One or more of the message, image, audio, video, or spokesperson
  • General ideas, ad mock-ups, or completely finished ads
  • Performance in different channels such as TV, radio, print, OOH, or social media
  • Performance against a competitor’s ad
  • Performance against an existing or in-market ad


  1. Create 2 to 4 compelling ad concepts. Though it seems like the first step of an ad testing is building the ads, this can’t be done until decisions are made about the ad’s objective, its intended audience, and its intended channel. With those specific details in hand, it’s time to build a set of ads with a clear message that differentiates the brand and speaks to the target audience. Make sure the ads have a clear Call-To-Action.


  1. Create data collection tool: Identify the specific questions that will address the KPIs and allow you to evaluate success. In addition, choose a set of complementary questions focused on the various aspects of the campaign that are most important. This could be related to the messaging, the presentation, the brand, or all of those aspects. Remember, for accurate comparisons, all of the questions should be applicable to all of the ads. For example, rather than asking about the piano in one ad and the violin in the other ad, ask about musical instruments or music in general.


  1. Decorative imageCollect and analyze the data. In addition to evaluating the KPIs to identify an overall winner, review all of the metrics to identify any poor performing aspects. Read through the open ends to identify concerns that weren’t anticipated or were left unaddressed in the questions. Further, review the KPIs within each individual segment. It’s very likely that one segment of people prefers a different ad, or that one ad will be more effective in a specific channel. Take advantage of a data dashboard to help find those unexpected insights quickly.


  1. Fix and retest. A thorough review of the data will help determine whether any aspects of the ads should be corrected or improved before launching. Make those changes and then retest to ensure the ad wasn’t inadvertently weakened. If you’re in a fortunate position that there is a clear winner with minimal to no weaknesses, congratulations!


  1. Launch the test. In order to ensure the results are as reliable as possible, keep the ad test in field for at least one week. This will give a wide range of people within the segment a chance to participate. Closing field after just a few hours might mean that only desk workers contributed opinions and the results won’t generalize to people who work shifts or who can only check their email once or twice per week.


  1. Benchmark the results. One of the great things about ad testing is that a few specific KPIs are generally included in every questionnaire. It’s important to maintain a database of these metrics which serves two purposes. First, when calculating KPIs for a brand new ad, it’s possible to compare it to previous ads for other brands you’ve tested. Those ads will likely be associated with in-market purchase data so it will be possible to predict the financial success of the current ad. Second, since the norms database indicates which ads were successful, it’s possible to create new ads that mirror the attributes of those successful ads. In either case, knowing what success can look like means your efforts can be focused in those areas.


What’s Next?

Are you ready to identify your best ads and improve them to match the needs and wants of your targeted audience? Email your project specifications to our research experts using Projects at E2Eresearch dot com. Let’s turn your ad enigmas into ad enlightenment!


Learn more from our case studies


Learn more from our other blog posts

How to conduct a journey mapping research project
By E2E Research | December 2, 2021

Journey maps are commonly created in the market and consumer industry to illustrate a set of steps taken to accomplish a goal. Well designed maps help marketers, brand managers, and researchers understand how people perceive and interact with overt and covert stakeholders, products, channels, and services along their way to completing that final goal.


Journey maps used to be simple, and the details and processes often seemed obvious. Today, however, with the internet in our pockets providing unlimited opportunities to talk to people around the world, learn about millions of new products and companies, and acquire nearly any product within hours or days of hearing about it, journeys are extremely complex. They’ve evolved from linear 5-step journeys into 30-stage ricocheting piles of spaghetti.


As such, it’s important to conduct well-rounded research to ensure erroneous assumptions and misconceptions aren’t included, and to ensure all aspects of the journey, both hidden and obvious, are accounted for.


Journey maps are more complicated and more necessary than ever.
..

.

What kinds of journeys can we map?

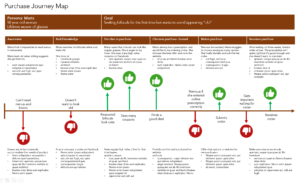
Nearly any journey wherein people progress through a set of stages, interacting with channels or people, over a short or long time frame to accomplish a goal can be mapped. Here are just a few of the more common journey maps that marketers and brand managers use.


  • Customer journeys: How do consumers, or your customers, discover the need for and end up buying a product? Where do they learn about various products, who do they talk to along the way, at what point do they finally buy one and how?
  • Patient journeys: How does a patient or care-giver discover a health issue and follow through to a treatment plan? What was the initial point of discovery, who did they talk to about their concerns at each step, when did they choose a healthcare provider, how did they choose from among the treatment options?
  • Recruitment journeys: How does a person decide to seek employment and follow through until they have settled into a new role? What created the initial interest, where did they turn to for advice about hiring companies, how did they select a best role?
  • Financial journeys: How does a person decide to buy a home and follow through on that major expenditure? What caused the interest in the beginning, where did they go for advice about large loans, and how did they choose a mortgage provider?

.

Why create a journey map?

Maps aren’t simply pretty pictures that make great wall posters. In addition to illustrating an entire journey on one convenient page, they serve a number of important purposes.


  • Facts over factoids: Assumptions about processes, pain points, strengths, and weaknesses are easily affected by context and perspective. Every brand manager, marketer, researcher, and customer has a different view of the journey which is affected by their role, life experience, and current needs. Data-driven journey maps are simply more accurate and all-encompassing than anecdata-driven journey maps.
  • Resolve issues: By mapping the journey, you’ll be able to identify strengths, weaknesses, and pain points that are negatively impacting people at any stage in the experience. You’ll learn which mobile apps need improved navigation, identify disjointed online and offline experiences that need fixing, and be better able to ensure people receive key messages at critical times via the channel they prefer.
  • Optimize spend: Once you discover which channels people are accessing – or not accessing – during their journey and what the strengths, weaknesses, and pain points of those channels are, you can allocate your spend more wisely. You may discover new channels, realize the need to optimize favorite channels, or decide to eliminate out-of-date channels.
  • Innovate: Journey maps will help you identify gaps in product development or processes that can be solved by creating new tools, products, or services.
  • Plan for the future: When you understand where your business is today, you can plan for tomorrow. Identify which experiences can be enhanced and improved for everyone.
  • Level-setting: When everyone has the same understanding of the journey, it’s easier to ensure that every touch-point meets your high standards and best practices. You’ll be better able to reduce silos and increase efficiencies of functions and tools across the company.
  • Understand personas/segments: Every product or service can be represented by multiple journey maps, each reflecting a unique segment of people. As you understand each segment more precisely, you can improve each experience in a more targeted, relevant way.

.

How to conduct a journey mapping research project

Set Clear Goals: The most important component of every research project, including journey mapping research, is to set clear goals and objectives for what you want and need to achieve. In addition to creating the map itself, you will need to specify how you intend to use the map once it’s complete. For example:


  • Why do so few people use the mobile app?
  • How can we better serve omnichannel customers?
  • Where are our communication gaps?
  • Why do we lose so many consumers after they call our help-line?

Review Secondary Research: Take the time to review any existing qualitative and quantitative research you may have conducted over the last several years. Though it may not directly focus on the journey experience, there are likely to be important tidbits of knowledge that will help you design your data collection instrument – take note of people, processes, and channels mentioned and ensure they are covered in the new instrument.


Detail the Research Questions: As you prepare to build your data collection tool, focus on all aspects of the human experiences – who, what, where, when, why, and how. Let high quality data tell you how many stages there really are rather than trying to fit people into preconceived notions.


  • Who: Which personas would benefit the most from journey mapping? Who are the direct and indirect people the consumer could possibly come into contact with? Consider people at the call-center, people answering questions on Twitter, people in finance, operations, and management who may be called in to help with more difficult problems.
  • What: What messages and information people need at each stage? What are their motivations? What are they getting or not getting? What are their pain points and barriers?

  • Where: Where do customers seek information or products? Are they experiencing the journey from home, work, school, or the retail outlets? Are they experiencing it on a mobile device, a desktop computer, or in person?
  • When: Think about how journeys change when they are experienced in the daytime, evening, nighttime, or weekends. Is the journey one day, one week, one month, or one year long?
  • Why: Why did customers start or stop each point in the journey?
  • How: How do customers feel about each point? How do they perceive each stage? What are they thinking and believing? Where is their breaking point or their moment of exhilaration?

Identify the Research Method: Ideally, both qualitative and quantitative research techniques should be used to ensure you capture all potential aspects of the journey. Starting with qualitative techniques allows you to probe deeply and ensure that subsequent quantitative techniques are properly informed.


  • In-Depth Interviews: Whether in-person, over the phone, or virtual, personal interviews are the perfect method for diving deep into every single aspect of an individual’s journey. Not only are first hand accounts great at creating empathy among company stakeholders, the ability to probe with multiple “whys” ensures you can dig down to the inner most held beliefs and opinions associated with a behavior.
  • Online Communities: Most journeys last far longer than a few minutes. Buying shampoo could be a ten minute or ten-day journey whereas a house hunting journey could take a year. Online communities are an effective way to bring people together to discuss each other’s unique journeys and discover which steps are common or unique, and why. For consumer goods mapping, you could even ask participants to maintain and share a diary throughout their journey.

  • Observational Research: We all know the saying that actions speak louder than words. That’s why it can be extremely beneficial to include observational research as part of journey mapping research. Most commonly, this research is conducted by researchers quietly observing people as they progress through their journey in retail outlets. However, observations can also be made of digital behaviors after first getting permission to record people’s browser activities.
  • Surveys: Finally, finishing with a quantitative survey will help ensure your final outcome is not only comprehensive, but also reflective of the broader population.  Remember to build surveys that incorporate data quality techniques and include fun question types that help participants remain engaged during the research process.

 .

What’s Next?

Are you ready to gain a thorough understanding of your customers’ journeys? Email your project specifications to our research experts using Projects at E2Eresearch dot com. We’d love to help you turn your enigmas into enlightenment!


Learn more from our case studies


Learn more from our other blog posts


Tracking Physician Perceptions of Diabetes Pharmaceutical Representatives | Case Study
By E2E Research | April 19, 2021

Research Objective

  • The pharma company needed to optimize channel effectiveness by understanding physician/sales rep interactions, in particular related to what their product does, how it can be best used, and physical aids used.
  • They also needed to understand pain points that physicians face during interactions to improve marketing materials and prescription process.


Scope & Methodology

A survey was used to measure:

  • Product knowledge displayed by sales reps
  • Preferences for Type 2 diabetes treatments
  • Marketing messages of GLP-1 treatments for Type 2 Diabetes
  • Reasons for not prescribing GLP-1 treatments and brands


Value Delivered

  • The research helped the pharma company understand marketing messages recalled by physicians for each product and how it impacted their prescription patterns.
  • They were able to understand the pain points physicians experienced during interactions with their pharma reps with particular regards to Type 2 diabetes treatments.


Check out other patient case studies