From Minecraft to Fortnite and from Pinterest to TikTok, there are innumerable highly entertaining ways for people to spend their free time with their cell phones, tablets, and computers. No matter the demographics of your audience, people of every age, gender, ethnicity and more have grown to love the swiping and dragging and audio/video capabilities of their favorite online hobbies. Participant engagement matters. A lot.
The only way for market, opinion, and social consumer researchers to compete with those experiences is to provide people with meaningful, realistic, and entertaining ways to communicate their product and service needs to companies.
Fortunately, the digital research experience of the 21st century has far surpassed the paper-cut and broken pencil tip experiences of the 20th century. We can now present research participants with visually accurate stimuli, static and animated imagery, audio and video prompts, and response options that go far beyond clicking in radio buttons and check boxes. If you can think of it, expert survey scripters can create it.
Here are eight question types that will help you build a more engaging questionnaire and inspire new ways to think about the research experience.
Create more realistic shopping moments.
 I’ve yet to wander through a brick-and-mortar store where every product was presented to me as a black and white written description with no imagery. If a study doesn’t require the external validity of an in-store or facility shelf test, consider creating a questionnaire with high quality artwork, photographs, and animations that reflect a more realistic product selection experience.
Simulate a retail environment in the digital space where products are shown on a shelf, and then selected and dropped into a shopping basket. Include product details and prices as necessary. Include competitive brands on the shelf and give them compelling details as well.
Let the human mind work in a more natural way.
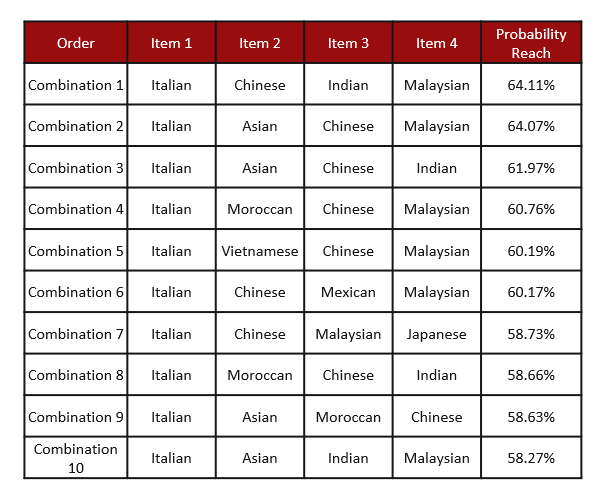
 Traditional questionnaires list out the brand names in alphabetical order and often ask people to assign rank order numbers to them. The most desirable product is assigned the number 1 while the least desirable product is assigned the number 5 or 10 or some other larger number.
But that’s not how we really think about products. When we’re in the store, we look at all the packages, we pick up a few packages and put them back, we hold one closer and then the other closer, and we might actually lay them sid
e by side in an order. A more personal experience can be simulated by using drag and drop questions that let people “pick up” product visuals, drop them into an order, and then drag them in a different order.
Similarly, when asked to rate product packages, websites, brochures, or other visual materials, it’s quite common for questionnaires to show an image and then pose a series of Likert scale questions. However, a Hotspot or Highlighter with drag and drop pinpoints and outlines is more natural and engaging. Think about how people normally critique a package – they hold it, point to areas, and highlight sections with their fingers. Being able to replicate an in-person experience is far more natural and meaningful.

.
.
.
.
.
Cater to different communication styles.
 Everyone communicates in different ways. Painters and authors and musicians (and those of us who aspire to be one of those!) find it easier to share opinions and ideas in visual or written or auditory ways. Further, some question types are better at capturing basic facts and straightforward opinions while other question types are better at capturing feelings and emotions.
We owe it to ourselves and to research participants to give everyone the opportunity to give answers that truly reflect how they feel. Instead of presenting page after page of written questions and answers, consider incorporating some visual, more projective questions that speak to the soul and the imagination. It’s a great way to think about brand or corporate personality and mission statements!
Collect audio and video responses.
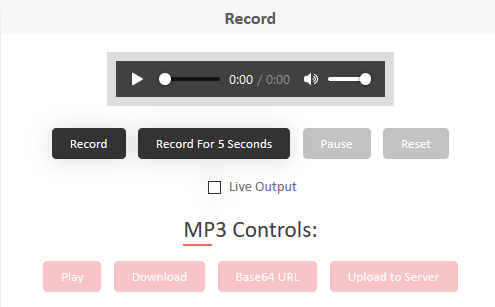 And of course, what about people who prefer to share their opinions and ideas verbally or visually? Digital devices make it very easy to share and capture both audio and video materials.
Instead of an open-end or “Please specify,” consider asking people to record themselves speaking. Similarly, ask them to take a photo or video of their fridge, pantry, medicine cabinet, desk, backyard, or car. We all know a picture is worth a thousand words. A video could be priceless!
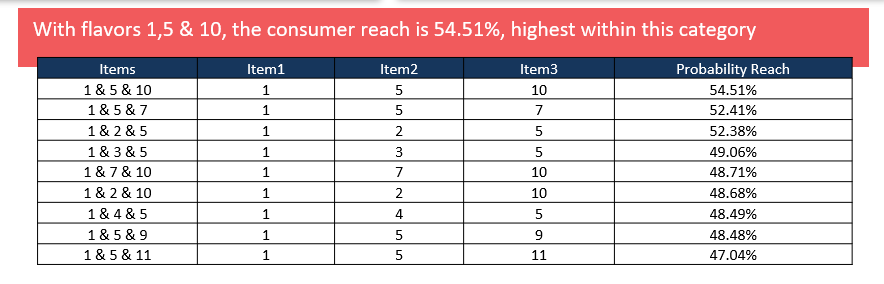
Help participants with the math.
 For quantitative researchers running tabulations and statistical analyses day after day, it’s easy to forgot how intimidating math is for many people. Fortunately, our digital devices are ready and willing to help. At the most basic level, researchers can design questions that automatically do the math for participants – no more, “Please make sure your numbers add to 100%.”
Now, we can even convert counts and percentages into slider questions so that sums will always equal 5.000, 10, 100%, or $100. Banish the fear of math and make numerical responses far easier and interesting!
Say goodbye to grid questions.
Grids are old news. They’re boring, they’re taxing on the eyes, and they cause people to disengage and lose focus. Fortunately, there are many ways to redesign them. One of my favorite ways to present Likert scale grid questions is to present each item individually with clickable color-coded answer option beneath. As each item is answered, the next item automatically pops up. Easy peasy and fast! It’s great for short, easy to read questions.
There are many other alternatives for grid questions. You could drag each item or image onto the scale. You could slide each item or image across its own unique scale. You could drag each item up a ladder with 5, 7, or 9 steps or place each item somewhere on a five-level podium.
There are so many options beyond the typical grid that can make the questionnaire experience just a bit more interesting.
Get qualitative information from a quantitative tool.
 When people agree to participate in a survey, they know they will be asked to click in circles and boxes, and select items from a list. Unfortunately, they’re often less interested in typing out long explanations of their answers.
However, when we convert a boring text box into an engaging storytelling exercise, it’s much more enjoyable to share information. Take a few minutes to figure out the story you want to hear from your customers. Work out a few story prompts and them guide them through a virtual book with pages that actually turn. With a bit of creativity, sharing verbatims can be enjoyable.
Ask for their final opinion about the questionnaire.
 You, the researcher, were in charge of 99% of the survey experience. You told participants what the questions were and you told them what their answers could be. Once you’ve reached the end of the survey, however, it’s time to let participants be in charge. End the questionnaire in a respectful but fun way by incorporating a question that uses a bit of creativity.
Ask for any additional comments that weren’t included in the questionnaire or if they’d like to share their opinion of the research experience. And make sure to act on their feedback!
In Sum
A survey incorporating all of these question types could be quite fun but there are a few rules.
- Don’t go overboard and use engaging question types for every single question. Sometimes, traditional questions really are the best question types. Focus on the sections of the questionnaire that are particularly challenging or disengaging, and sprinkle little bits of fun throughout.
- Don’t aim to use as many different question types as possible. Choose two or three that really meet your needs. Consistency makes for better data quality and it helps participants feel more comfortable with their task.
- Rather than starting with a bang, try to end with a bang. If the only place to incorporate an engaging question is at the very beginning of a questionnaire, think about whether you really need that question. You don’t want to question #1 to be amazing and then follow that up with ten minutes of boring traditional questions.
- Remember that more than a third of participants answer questionnaires on mobile devices. Be aware of the size and space limitations those devices have. Remember that not everyone will be in an environment where they can play sounds and movies. Choose question types that are appropriate for your audience, their locations, and their devices.
The widgets you see here are just a few of the more than 100 templated and fully customizable widgets we’ve already built for our clients. With your imagination and your knowledge of your products and your consumers, any of these widgets could be customized to meet your specific needs. Or, if you’ve been inspired and have an idea for a brand new question, let us know! We’d love to create an engaging question just for you. Your imagination is the limit!
Download our Questionnaire Engagement Share Sheet to learn how we help research companies throughout the entire survey design, scripting, analysis, and reporting process. Or, feel free to email your project specifications to our research experts using Projects at E2Eresearch dot com.
Learn more from our case studies
Great reads about questionnaire design