To successfully grow your business, people need to know your brand exists. By measuring brand awareness, you can ensure your marketing strategies are doing exactly that. Before wasting a lot of time and money in the wrong places.
There are a variety of ways to measure brand awareness, each with their own purpose, requirements, advantages, and disadvantages. From direct and indirect to individual and group metrics, this list will help you choose the set of metrics that best suits the goals you have for your brand.
Direct Measures
Unaided Awareness: Unaided awareness is a very common metric wherein a targeted sample of people are asked to name any brands they can think of in a certain category. For instance, “Name five brands of computers” or “Name every brand of facial tissue you can think of.”
Pros: If people do name your brand, it’s clear that they are aware of it. This is particularly true if your brand name isn’t common or is difficult to spell.
Cons: People might not remember your brand name in the moment. Or, maybe they assumed that naming several brands was sufficient and they stopped just before naming your brand – which they did know. Just because people didn’t name your brand doesn’t mean they aren’t aware of it. You might consider this metric the lower bound of true awareness.
 Binary Aided Awareness: Perhaps the most common and well-known metric is Aided Awareness. It’s usually measured in combination with, and after, unaided awareness by asking a targeted sample of people a simple yes/no question like “Before now, have you heard of E2E Research?”
Pros: It’s direct, clear, and won’t confuse readers. It’s easy to measure among a wide range of target audiences and regions without the need for any special software or technology.
Cons: However, this question suffers from acquiescence bias. Research participants very much want to help researchers achieve positive results and this includes trying to remember things they actually don’t quite remember. Perhaps they feel like they should remember the name or that they’ve probably heard the name, and consequently select “yes” when they shouldn’t. It’s not necessarily done out of malice, but rather poor memory or a conscious or unconscious desire to be helpful.
Multi-Select Aided Awareness: Unlike binary aided awareness, multi-select metrics present 5 to 10 brands for people to react to. People might recognize none, some, or all of the brands. The question usually looks something like “Before now, which of these brands had you heard of?”
Pros: Because people can’t tell what the target brand is, there is less incentive or desire to provide a positive “yes” response to every single brand. It feels natural to leave some brands unselected because people know they haven’t heard of every brand that exists. As such, this technique works well for brands that are uncommon or rare.
Cons: People could still select brands that they’ve never heard of before simply because people are being people. That’s why it’s a great idea to include some fake brand names which serve as a baseline for false memory.
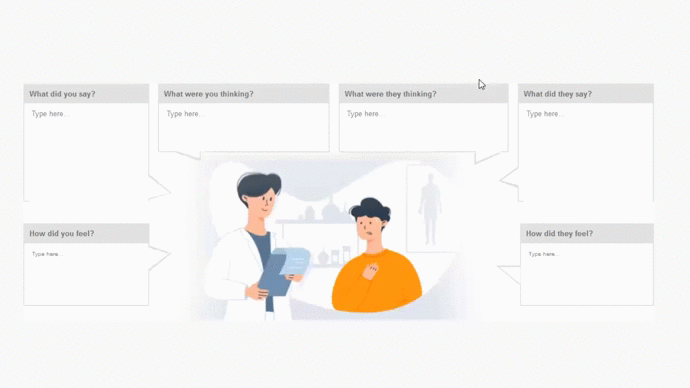
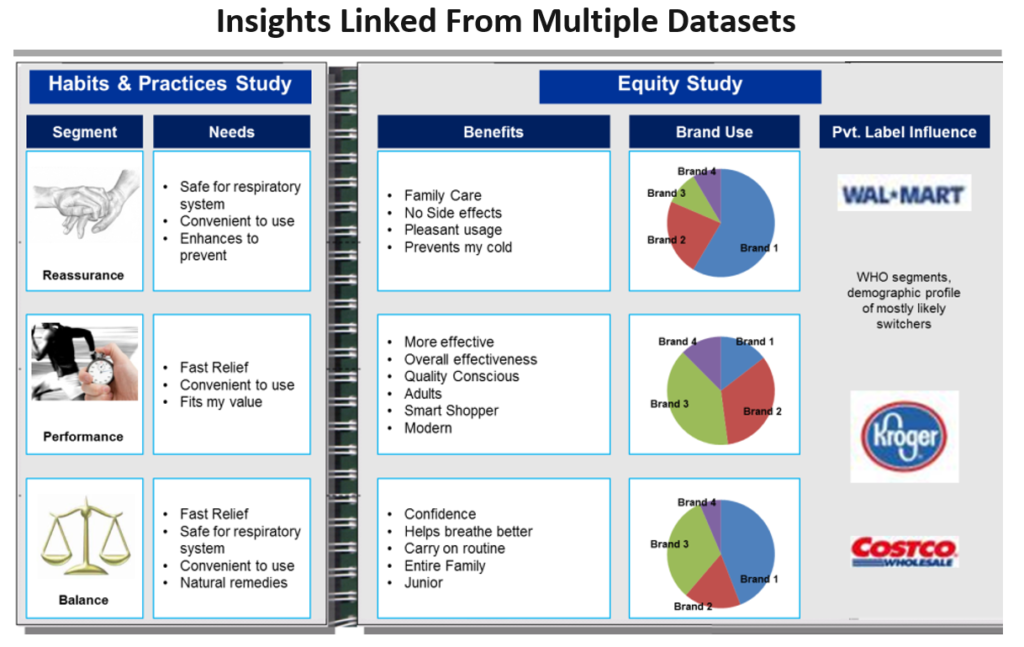
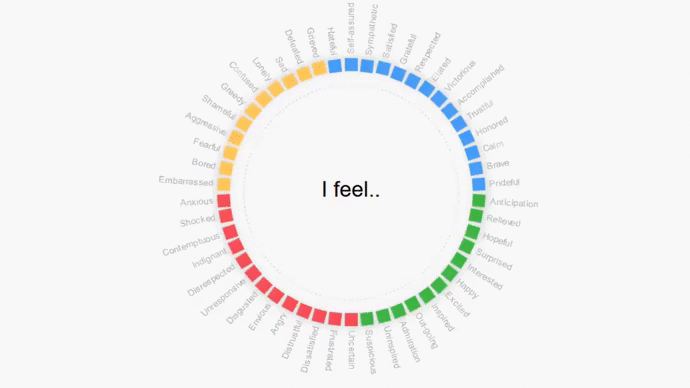 Attribute Awareness: Go beyond simple recognition of your brand name to understand whether people know what your brand is about. It’s certainly not brand awareness if people know your brand has something to do with food but they don’t know if it’s dried soup or soda.
After you have confirmed that people can recognize your brand name, invite them to select or write out a series of words to describe the brand’s main category or key features. The animated gif illustrates the selection of emotions but it could also reflect a set of product categories or features.
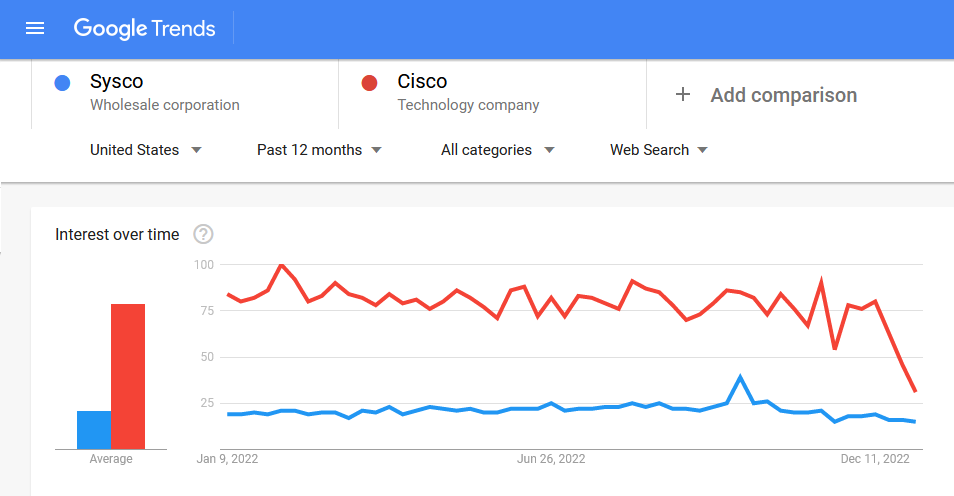
Pros: This method ensures that people know when you’re referring to Dove soap vs Dove chocolate, or that Sysco food distributors Is not the same as Cisco technology.
Cons: People may genuinely recognize your brand name but without context, they may be unable to identify the category or key features perhaps because of poor marketing and branding tactics.
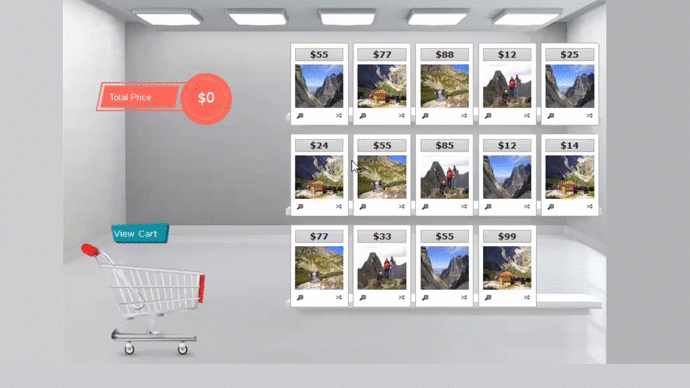
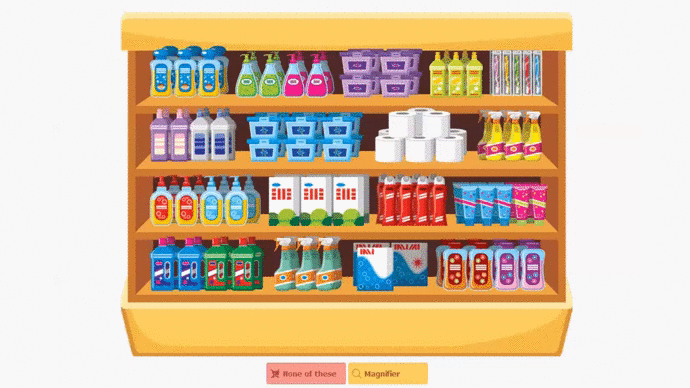 Shelf Display Awareness: Another option is to present an image of product packages on a retail shelf. People can then click on all the package images they recognize. You might even wish to include package images from other categories or fake packages as distractors. (“Please click on every cereal package you recognize.”)
Pros: People may find it easier to recognize a brand when it’s presented in a familiar context such as a store shelf. This is particularly helpful for brands that people don’t have a personal connection with, those secondary products that back up their favorite brands.
Cons: Is it really brand awareness if people know what your package looks like but they can’t associate a brand name with it? Rote purchases based on shelf location and package design won’t necessarily turn into repurchase if someone always grabs the first green item on the third shelf.
Logo Awareness: Similar to shelf display awareness, you could present people with a set of product logos and ask them to click on the logos they recognize.
Logos that don’t incorporate the brand name are particularly good for this metric, e.g., Pepsi, Windows, NBC. Some logos that incorporate the brand name could be de-branded, e.g., Chanel, Reebok, Nike.
In cases where the logo is the brand name, you could even try recreating the color, font, shape, and size of the word with nonsensical line art, e.g., FILA, PUMA, Coca-Cola, Prada.
Pros: Many people find it easier to recognize imagery rather than words so this metric could be helpful for them.
Cons: Of course, if people know they’ve seen your logo before but they’re unable to match it with a brand name, you know your marketing needs some work. They could still be very much aware of your brand but not your logo.
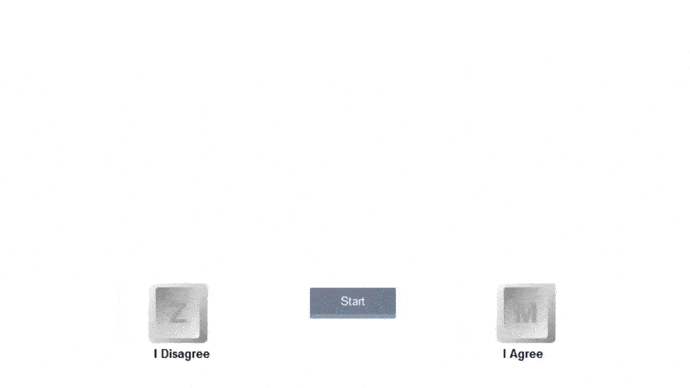 Implicit Awareness: One of my favorite metrics for brand awareness is implicit awareness. This method relies on unconscious brain activity as an indicator of awareness. It can be conducted in a variety of ways but the most basic method is as follows.
A set of extremely well known (e.g., Coca-cola, Nike, Starbucks) brands, unknown brands, competitive brands, and the brand you wish to test is created. Brand names are then presented to people one at a time in random order.
Whether through biometric measurements or physical button clicking, the number of nano/milliseconds it takes to react to the brand name is recorded. A super fast biometric reaction or click of the Z vs M key indicates their level of familiarity with the brand whereas a much slower reaction indicates less awareness.
Pros: Because this metric is unconscious, acquiescence bias is easy to overcome and it’s difficult to fake knowledge or lack thereof. This is particularly good for brands that people might be embarrassed to claim awareness of, e.g., incontinence products, sexual dysfunction products.
Cons: Because everyone has a different baseline for reaction times, you must measure reactions to a large number of brands. And, you’ll need to use for-purpose technology because it’s impossible to measure nano/milliseconds with the necessary degree of accuracy for this technique.
Indirect Measures
As with any metric, corroborating results via multiple methods is the best way to know you’re actually measuring what you think you’re measuring and that your result is reliable. In addition to using 2 or more direct measures, consider adding at least one indirect measure to your toolkit.
Keep in mind that many of the indirect metrics suffer from a common set of disadvantages. For instance, without using a targeted sample of people, rates are easily over/under estimated and rank orders won’t be accurate. Never consider an indirect metric to be your best measure of brand awareness.
 Social Media Followers: The number of people following your social media accounts is a helpful indicator of brand awareness. Highly popular and well-known brands like Coca-Cola have thousands or millions of followers on Instagram, Pinterest, Tik-Tok, and other social media sites.
Pros: These metrics are easy and free to gather, and work well for extremely common, consumer-oriented brands.
Cons: Many people either don’t use social media or choose not to follow brands or companies on social media, particularly brands that aren’t personal or consumer focused, e.g., brands of carpets, wiring, paper. While the numbers are a helpful indictor, they will not reveal accurate volumes or rank orders.
Social Media Mentions: If you search for a brand on a social media channel, you will likely see how many times the brand has been mentioned. Obviously, a large number of mentions means a lot of people are aware of the brand.
Pros: Brands with a high number of mentions likely have high brand awareness. This is a helpful metric for personal, consumer focused brands.
Cons: Take care that the mentions you are counting aren’t all coming from the same few people. And, make sure they aren’t refering to something else, e.g., Apple computers vs apple pie. And, as with other indirect measure, having the most mentions does not correspond to having the highest brand awareness. Rankings are impossible to discern from social media mentions.
 Google Trends: This website tracks monitors the number of people using specific search terms while using Google browsers.
Pros: Brands that are searched for a lot are more likely to have high awareness. As such, consumer focused brands will be more able to take advantage of this metric.
Cons: Search results can be confounded with a lot of factors. Words with similar sounds or spellings can be confused for your brand. Not everyone uses Google to search for information (remember Bing, Baidu, Yahoo?). People don’t necessarily search for brands even if they are very much aware of those brands and use them everyday. And, searches are often not awareness, but rather an indication that someone isn’t aware of a brand, e.g., “What is Pantene?” As such, it is impossible to trust the rank orders of brands with Google Trends.
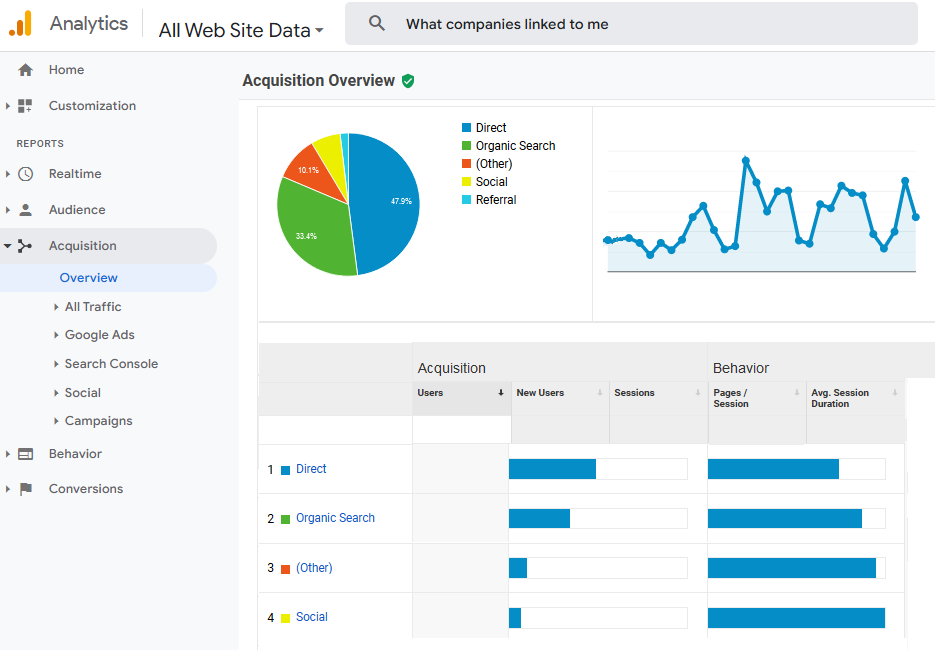 Referral Traffic: If you’re lucky enough to have direct access to your website analytics, you might notice where your website traffic is coming from. Perhaps it’s sourced from industry association websites or from competitive companies. Counting inbound clicks coming from industry websites is another interesting indicator of awareness.
Pros: If association websites and competitive websites send links your way, you can be assured that your brand awareness is high. This is definitely a case where competitors want to be associated with the best in class!
Cons: Whereas industry associations are open to linking to any company in their industry, many competitive companies have policies that forbid them from linking to their competitors. They may definitely be aware of you but will also definitely never show up in your referral traffic.
Review Sites: Many product buyers and users take the time to write online reviews. New or rare brands may find they have just a few reviews whereas extremely well-known brands may have thousands or millions of reviews.
Pros: When people take the time to review your brand, you know they have personal experience with your brand name and have connected with you in either a positive or negative way.
Cons: As with other measures, a lack of reviews does not correspond to lack of awareness. Products or services that are generally fine might never receive as many reviews as a tiny brand that produces a horrible product or, conversely, an amazing product.
What’s Next?
Are you ready to identify and monitor brand awareness among your buyers and users? Email your project specifications to our research experts using Projects at E2Eresearch dot com. We’d love to help you turn your enigmas into enlightenment!
Learn more from our case studies
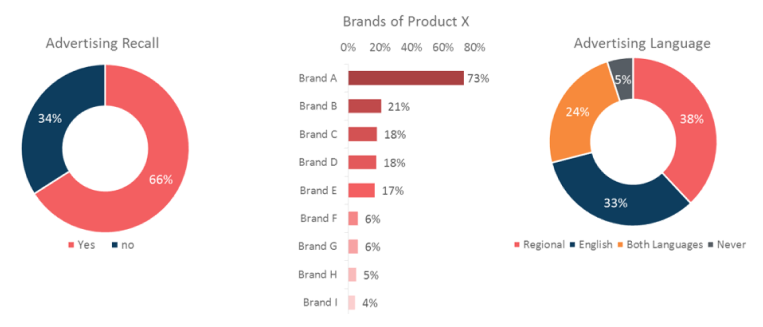
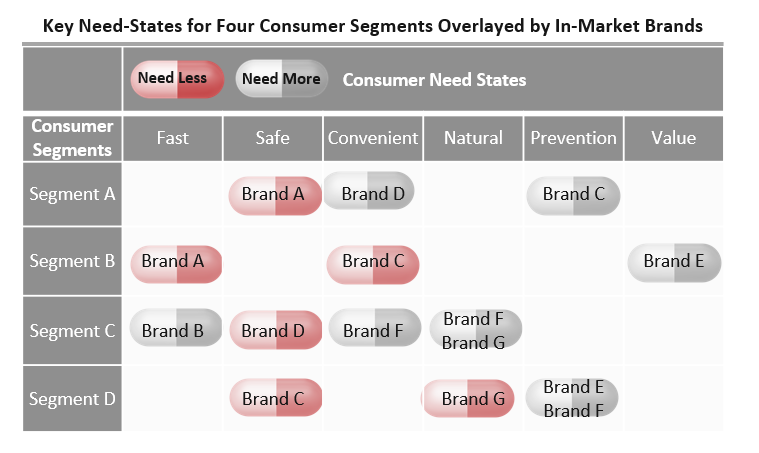
- Benchmarking Brand Awareness and Competitive Brand Space – A consumer food survey case study
- Evaluating the Effectiveness of a Campaign with Brand and Message Recall – A consumer media survey case study
- Increasing Enrollment Through A More Meaningful Brand Purpose – An education survey case study
- Modeling a Consumer Response Hierarchy to Guide Brand Strategy – A personal care survey analytics case study


 Amazon: Since starting up as a book seller, Amazon’s focused effort on meeting customer needs has resulted in amazing brand equity. Because of their unquestioning return policies, unending selection, and ability to get product in hand in mere hours, customers are fiercely loyal. That’s positive brand equity.
 Toms: People love the Toms shoe company. Why? Not only do they make a great shoe, they donate a pair of shoes with every purchase. This human centered value makes customers feel good about their purchases, and keeps them coming back again and again to support a company that matches their own values.