Request a quote!

Blog, News &

Case Studies

12 Ways to Measure Brand Awareness
By E2E Research | February 7, 2023

To successfully grow your business, people need to know your brand exists. By measuring brand awareness, you can ensure your marketing strategies are doing exactly that. Before wasting a lot of time and money in the wrong places.


There are a variety of ways to measure brand awareness, each with their own purpose, requirements, advantages, and disadvantages. From direct and indirect to individual and group metrics, this list will help you choose the set of metrics that best suits the goals you have for your brand.


Direct Measures


Unaided Awareness: Unaided awareness is a very common metric wherein a targeted sample of people are asked to name any brands they can think of in a certain category. For instance, “Name five brands of computers” or “Name every brand of facial tissue you can think of.”


Pros: If people do name your brand, it’s clear that they are aware of it. This is particularly true if your brand name isn’t common or is difficult to spell.


Cons: People might not remember your brand name in the moment. Or, maybe they assumed that naming several brands was sufficient and they stopped just before naming your brand – which they did know. Just because people didn’t name your brand doesn’t mean they aren’t aware of it. You might consider this metric the lower bound of true awareness.


Decorative imageBinary Aided Awareness: Perhaps the most common and well-known metric is Aided Awareness. It’s usually measured in combination with, and after, unaided awareness by asking a targeted sample of people a simple yes/no question like “Before now, have you heard of E2E Research?”


Pros: It’s direct, clear, and won’t confuse readers. It’s easy to measure among a wide range of target audiences and regions without the need for any special software or technology.


Cons: However, this question suffers from acquiescence bias. Research participants very much want to help researchers achieve positive results and this includes trying to remember things they actually don’t quite remember. Perhaps they feel like they should remember the name or that they’ve probably heard the name, and consequently select “yes” when they shouldn’t. It’s not necessarily done out of malice, but rather poor memory or a conscious or unconscious desire to be helpful.


Multi-Select Aided Awareness: Unlike binary aided awareness, multi-select metrics present 5 to 10 brands for people to react to. People might recognize none, some, or all of the brands. The question usually looks something like “Before now, which of these brands had you heard of?”


Pros: Because people can’t tell what the target brand is, there is less incentive or desire to provide a positive “yes” response to every single brand. It feels natural to leave some brands unselected because people know they haven’t heard of every brand that exists. As such, this technique works well for brands that are uncommon or rare.


Cons: People could still select brands that they’ve never heard of before simply because people are being people. That’s why it’s a great idea to include some fake brand names which serve as a baseline for false memory.


Decorative imageAttribute Awareness: Go beyond simple recognition of your brand name to understand whether people know what your brand is about. It’s certainly not brand awareness if people know your brand has something to do with food but they don’t know if it’s dried soup or soda.


After you have confirmed that people can recognize your brand name, invite them to select or write out a series of words to describe the brand’s main category or key features. The animated gif illustrates the selection of emotions but it could also reflect a set of product categories or features.


Pros: This method ensures that people know when you’re referring to Dove soap vs Dove chocolate, or that Sysco food distributors Is not the same as Cisco technology.


Cons: People may genuinely recognize your brand name but without context, they may be unable to identify the category or key features perhaps because of poor marketing and branding tactics.


Decorative imageShelf Display Awareness: Another option is to present an image of product packages on a retail shelf. People can then click on all the package images they recognize. You might even wish to include package images from other categories or fake packages as distractors. (“Please click on every cereal package you recognize.”)


Pros: People may find it easier to recognize a brand when it’s presented in a familiar context such as a store shelf. This is particularly helpful for brands that people don’t have a personal connection with, those secondary products that back up their favorite brands.


Cons: Is it really brand awareness if people know what your package looks like but they can’t associate a brand name with it? Rote purchases based on shelf location and package design won’t necessarily turn into repurchase if someone always grabs the first green item on the third shelf.


Logo Awareness: Similar to shelf display awareness, you could present people with a set of product logos and ask them to click on the logos they recognize.


Logos that don’t incorporate the brand name are particularly good for this metric, e.g., Pepsi, Windows, NBC. Some logos that incorporate the brand name could be de-branded, e.g., Chanel, Reebok, Nike.


In cases where the logo is the brand name, you could even try recreating the color, font, shape, and size of the word with nonsensical line art, e.g., FILA, PUMA, Coca-Cola, Prada.


Pros: Many people find it easier to recognize imagery rather than words so this metric could be helpful for them.


Cons: Of course, if people know they’ve seen your logo before but they’re unable to match it with a brand name, you know your marketing needs some work. They could still be very much aware of your brand but not your logo.


Decorative imageImplicit Awareness: One of my favorite metrics for brand awareness is implicit awareness. This method relies on unconscious brain activity as an indicator of awareness. It can be conducted in a variety of ways but the most basic method is as follows.


A set of extremely well known (e.g., Coca-cola, Nike, Starbucks) brands, unknown brands, competitive brands, and the brand you wish to test is created. Brand names are then presented to people one at a time in random order.


Whether through biometric measurements or physical button clicking, the number of nano/milliseconds it takes to react to the brand name is recorded. A super fast biometric reaction or click of the Z vs M key indicates their level of familiarity with the brand whereas a much slower reaction indicates less awareness.


Pros: Because this metric is unconscious, acquiescence bias is easy to overcome and it’s difficult to fake knowledge or lack thereof. This is particularly good for brands that people might be embarrassed to claim awareness of, e.g., incontinence products, sexual dysfunction products.


Cons: Because everyone has a different baseline for reaction times, you must measure reactions to a large number of brands. And, you’ll need to use for-purpose technology because it’s impossible to measure nano/milliseconds with the necessary degree of accuracy for this technique.


Indirect Measures


As with any metric, corroborating results via multiple methods is the best way to know you’re actually measuring what you think you’re measuring and that your result is reliable. In addition to using 2 or more direct measures, consider adding at least one indirect measure to your toolkit.


Keep in mind that many of the indirect metrics suffer from a common set of disadvantages. For instance, without using a targeted sample of people, rates are easily over/under estimated and rank orders won’t be accurate. Never consider an indirect metric to be your best measure of brand awareness.


Decorative imageSocial Media Followers: The number of people following your social media accounts is a helpful indicator of brand awareness. Highly popular and well-known brands like Coca-Cola have thousands or millions of followers on Instagram, Pinterest, Tik-Tok, and other social media sites.


Pros: These metrics are easy and free to gather, and work well for extremely common, consumer-oriented brands.


Cons: Many people either don’t use social media or choose not to follow brands or companies on social media, particularly brands that aren’t personal or consumer focused, e.g., brands of carpets, wiring, paper. While the numbers are a helpful indictor, they will not reveal accurate volumes or rank orders.


Social Media Mentions: If you search for a brand on a social media channel, you will likely see how many times the brand has been mentioned. Obviously, a large number of mentions means a lot of people are aware of the brand.


Pros: Brands with a high number of mentions likely have high brand awareness. This is a helpful metric for personal, consumer focused brands.


Cons: Take care that the mentions you are counting aren’t all coming from the same few people. And, make sure they aren’t refering to something else, e.g., Apple computers vs apple pie. And, as with other indirect measure, having the most mentions does not correspond to having the highest brand awareness. Rankings are impossible to discern from social media mentions.


Decorative imageGoogle Trends: This website tracks monitors the number of people using specific search terms while using Google browsers.


Pros: Brands that are searched for a lot are more likely to have high awareness. As such, consumer focused brands will be more able to take advantage of this metric.


Cons: Search results can be confounded with a lot of factors. Words with similar sounds or spellings can be confused for your brand. Not everyone uses Google to search for information (remember Bing, Baidu, Yahoo?). People don’t necessarily search for brands even if they are very much aware of those brands and use them everyday. And, searches are often not awareness, but rather an indication that someone isn’t aware of a brand, e.g., “What is Pantene?” As such, it is impossible to trust the rank orders of brands with Google Trends.


Decorative imageReferral Traffic: If you’re lucky enough to have direct access to your website analytics, you might notice where your website traffic is coming from. Perhaps it’s sourced from industry association websites or from competitive companies. Counting inbound clicks coming from industry websites is another interesting indicator of awareness.


Pros: If association websites and competitive websites send links your way, you can be assured that your brand awareness is high. This is definitely a case where competitors want to be associated with the best in class!


Cons: Whereas industry associations are open to linking to any company in their industry, many competitive companies have policies that forbid them from linking to their competitors. They may definitely be aware of you but will also definitely never show up in your referral traffic.


Review Sites: Many product buyers and users take the time to write online reviews. New or rare brands may find they have just a few reviews whereas extremely well-known brands may have thousands or millions of reviews.


Pros: When people take the time to review your brand, you know they have personal experience with your brand name and have connected with you in either a positive or negative way.


Cons: As with other measures, a lack of reviews does not correspond to lack of awareness. Products or services that are generally fine might never receive as many reviews as a tiny brand that produces a horrible product or, conversely, an amazing product.


What’s Next?

Are you ready to identify and monitor brand awareness among your buyers and users? Email your project specifications to our research experts using Projects at E2Eresearch dot com. We’d love to help you turn your enigmas into enlightenment!


Learn more from our case studies


Learn more from our other blog posts

Innovation Strategy: Why just innovating isn’t enough
By E2E Research | January 30, 2023

Innovate or die.


I suspect many of us have heard that quote, usually attributed to Peter Drucker.


The goal of innovation is to create products or services that have original value, perhaps in response to changing industries or solving impeding social, health, or economic challenges. With an effective strategy for bringing about that innovation, your brand can achieve real change and growth. Without an innovation strategy, well, your brand could simply wither away and disappear.


Benefits of Innovation


Is it worth the financial burden to take time away from day-to-day production to focus on innovation? Given the following benefits, successful marketing and business leaders would say yes.


  • Remain relevant. In a world that’s constantly evolving culturally, economically, and politically, innovation helps brands remain relevant to people of today, not ten or fifty years ago when the brand was first launched. For example, today, brands take care to understand that gender is a social construct, not a precise measurement that dictates women use pink razors and men use black razors. And, remaining relevant means we work to understand changing consumer perceptions towards online ordering, something that really picked up over the last three years.
  • Develop new products. For creative minds, one of the key benefits of innovation is creating brand new products like pet food made from insect protein. Perhaps you’ve discovered a new pain point, audience segment, journey, or channel that warrants building a for-purpose product. Even better, starting from scratch means you can build in privacy, accessibility, sustainability, and many other core features right from the beginning rather than trying to hack them in at a later date.
  • Improve your existing products. Innovation is not just about creating new products. It’s also about improving the efficacy of existing products and appealing to new target audiences with those existing products. Growth comes from creating a more valuable product for your existing customers, and new value for new customers.
  • Optimize your costs. Innovation can also take place in systems and processes. New methods of building a product, delivering a service, or running operations can speed things up or make them less expensive. For example, we now have the option to use automated signature tools rather than physically mailing or even emailing business contracts.


Of course, all of these benefits contribute to the growth and expansion of the business with new or more desirable revenue streams.


Benefits of an Innovation Strategy

Innovating alone is insufficient to maintain growth. Creating an effective strategy to bring those innovations to life is essential for preparing for long-term unanticipated lows and desirable highs. There are other benefits as well.


  • Align everyone to the same goals. Creating an innovation strategy helps ensure efforts in all departments and groups are in keeping with the mission and vision of your business. When everyone has the same understanding of how innovation fits into the business growth strategy, every department can aim for the same, overarching goals rather than pursuing unrelated and unfocused individual goals.
  • Focus resources. When everyone is aligned to the same goals, company resources, whether financial, personnel, or otherwise will be used much more wisely. Less waste, less distraction, and more energy spent in the right places.
  • No resting on laurels. It’s easy to recall the good old days when you accomplished that awesome ‘thing.’ But 5 years ago is ancient in today’s world. Hundreds of new products and companies have since been launched, all of which have the potential to knock your brand out of the top 10 or top 1000 spot. You need to keep on proving that you deserve to be in the top 10 spot or someone else will. Without a strategy to stay there…. you won’t.


What Does a Successful Innovation Strategy Look Like


Though every company has a unique innovation strategy, successful strategies share a number of key characteristics.

  • Continuous rather than ad hoc. Rather than developing innovations in response to external events, successful strategies have a goal of continuous improvement. Time and funds for innovation are built into every process. It’s expected at every stage from every person.
  • Calculated risks. Playing it safe is rarely a good attribute of successful strategies. Be prepared to take risks along the way. Stretch your ideas just out of bounds to see what could be. Iterate, test, repeat.
  • Embrace failure. Successful innovation strategies embrace every small and large failure that inevitably happens along the way, recognizing that each one is a learning opportunity. Learn from each challenge and put processes into place to ensure those mistakes can’t happen again. Seek out and embrace criticisms and challenges. Caught early, resolving small challenges will prevent massive mistakes.
  • Measure the efforts. Successful strategies keep count. Count the failures, the successes, the ideas, the launches. Set fair expectations for both contributors and the leadership team around those metrics so everyone can monitor growth.
  • Create and stick to timelines. Create fair timelines and stick to them. Time spent on innovations that get repeatedly delayed and never become reality are a waste of everyone’s time.
  • Get stakeholder buy-in. Rather than waiting until an innovation is ready to launch, successful innovation strategies get buy-in from the leadership team from day one to ensure those innovations are in keeping with the long-term goals of the company. Without early buy-in and ongoing progress reports, those efforts could be completely wasted.


What’s Next?

Are you ready to get creative and put innovation at the top of your strategic plan? Our expert team is ready to help you gain new insights about your buyers, brands, and business that will support your next big innovation! Email your project specifications to our research experts using Projects at E2Eresearch dot com. We’d love to help you turn your enigmas into enlightenment!


Podcasts You Might Like


Books You Might Like


Learn more from our case studies


Learn more from our other blog posts
A Beginner’s Guide to Usage and Attitude Studies
By E2E Research | January 11, 2023

Ah, a rose by any other name smells just as sweet! Roses? Well, instead of using the phrase Usage and Attitude, you might hear some people use the phrase Habits and Practices. And instead of shortening it down to U&A, they’ll shorten it down to H&P. Whether you’re interested in a U&A or an H&P, we’re generally talking about the same thing. Use the acronym you prefer and we’ll all gain more valuable insights into consumer behavior, attitudes, and usage patterns.


What is a Usage and Attitude Study?

Decorative imageUsage and Attitudes studies aim to understand a broad range of behaviors and attitudes related to the people experiencing a product or service. It’s relevant for all products like food, beverages, hair care, and electronics, as well as services like healthcare, banking, and education.


Most U&As gather information about the brand of interest, as well as competitive brands and the category as a whole. This ensures you gain a full understanding of any behaviors and attitudes that could eventually be relevant and important to the brand of interest.


Why is a Usage and Attitude Study Important?

U&As create a solid foundation for building a brand. They serve a number of important benefits in a variety of key areas.


People: Know your buyer and your consumer
  • Create more relevant and memorable messaging by understanding the unique demographic and psychographic characteristics of each segment of users that has been identified in any segmentation research you’ve conducted
  • Understand purchase drivers associated with each persona, e.g., price, availability, loyalty, packaging, sensory features, sustainability, durability
  • Plan for the future by identifying what each segment needs and wants from an ideal product
  • Differentiate between the needs of buyers (e.g., availability, pricing) and users (e.g., efficacy, sensation), and ensure the targeted message reaches each audience


Place: Know your buyers’ preferred information and purchase channels
  • Focus your marketing spend in the most effective channels by identifying the marketing and sales channels and influencers that are most effective and important at each stage of the purchase journey


Pricing: Know your buyers’ preferred pricing models
  • Create the most effective pricing model by understanding attitudes towards various pricing strategies, e.g., every day low pricing vs sales vs bundling


Promotion: Know your buyers’ preferred promotion tactics
  • Create the most effective promotion model by understanding which types of promotions are relevant for your buyers, e.g., in-store promotions, OOH promotions, door-to-door promotions


Product: Know what your consumer needs and wants from your product
  • Prevent switching and abandonment by identifying and resolving frustrations, complaints, and pain points
  • Encourage purchase by identifying and reminding people of desired benefits and advantages
  • Plan product improvements by understanding which product features people love and hate


Strategy: Know how to position and plan for the future

Decorative image


What Questions to Ask in a Usage and Attitude Study

Decorative imageAs with any research project, there is an unlimited number of questions that could be asked. The key is to identify the specific research objectives for the imminent research project and focus the questions there.


Then, select a set of engaging questions that will keep the entire questionnaire to less than 15 minutes long. Don’t try to do everything or the data quality will suffer.


Brand Metrics
  • Awareness: When you think of this product category, which brands come to mind first?
  • Aided Awareness: From this list of brands, which ones have you heard of?
  • Discovery: How did you first hear about this brand?
  • Trial: Which brands of this category have you ever tried?
  • Trial: Why did you decide to try this brand?
  • Consideration: When you think of this product category, which brands would you consider buying?
  • Consideration: From this list of brands, which ones would you considering buying?
  • Preference: When you think of this product category, which brand do you most prefer?
  • Loyalty: If your preferred brand was not available in your usual store, what would you do?
  • Perceptions: Which 5 of these words reflect your opinions about this brand?
  • Perceptions: What 3 things do you like about this brand? What 3 things do you dislike about this brand?
  • Perceptions: Which of these brands is most innovative? Fun? Likeable? Effective? Appealing? Different?
  • Perceptions: What is your opinion about the effectiveness of this brand? Quality? Appearance? Texture? Taste? Scent? Sound? Durability? Sustainability?
  • Perceptions: Overall, what is your opinion about this brand?


Product Usage
  • In your household, which of these people use this category?
  • In your household, who uses this category most often?
  • Where in your home is this category used?
  • At what time of day/week/month/year is this category used?
  • How is this category used?
  • What occasions is this category used for? Every day? Holidays? Religious days? Birthdays?


Decorative imagePurchase Journey:
  • Who usually buys the product?
  • What are all the places where this category/brand is bought?
  • Where is this category/brand usually bought?
  • Where do you prefer to buy this category?
  • On the next shopping trip, which brands will be bought?


Purchase Frequency / Recency / Monetary
  • How often is each of these brands bought?
  • How often is each of these brands used?
  • In just the last 7 days, which of these brands have been bought?
  • When was the last time each of these brands have been bought?
  • What size package of category/brand is usually bought? What size is preferred?
  • At what time of the day/week/month/year is this brand/category usually bought?
  • The last time this category/brand was bought, about how much was spent on it?
  • The last time this category/brand was bought, were any coupons or cost savings used?
  • What is your opinion about using coupons? Buying at regular price? BOGOs?


Personal Details
  • Demographics: Age, gender, income, education, ethnicity, religion, household size, children in home
  • Psychographics: Personal attitudes towards relevant category characteristics, e.g., sustainability, early adoption, pricing preferences


Why Ask About Behaviors that Can Be Measured Digitally?


Decorative imageIf time and money were no objectives, many metrics could be confirmed visually or digitally. Sometimes, however, it’s faster and easier to just ask people. Sometimes the data isn’t available in a properly formatted, readable database. Sometimes the data isn’t available for purchase. And sometimes, we need to match attitude data with behavior data for specific people.


Or, and this is much more interesting, maybe we want to understand what people think they are doing. The way people think about or recall their behaviors is an indirect measure of awareness, loyalty, believability, and likeability. If people can’t remember which brand they buy, whether the name or the logo, that’s not a great indicator of brand loyalty which could permit a premium pricing strategy.


What’s Next?

Most brands are well served to conduct a U&A study. If you’re ready to discover top quality insights about your buyers, brands, and business, email your project specifications to our research experts using Projects at E2Eresearch dot com. We’d love to help you turn your enigmas into enlightenment!


Learn more from our case studies


Learn more from our other blog posts


Challenge the Market Research Status Quo
By E2E Research | December 21, 2022

Market research is all about disrupting the status quo.


We aim to discover what the average person likes or dislikes about a brand and then improve those things to increase our chances of success. We try to change perceptions about brands people think they don’t like so that they’ll switch to our brand. We work really hard to change other people’s attitudes and behaviors.


But what are we changing about ourselves?


Humans use routine and cognitive biases to simplify and speed up their decision-making processes, and marketing research is overflowing with those routines.


Why do we use the same 30-minute tracker or U&A questionnaire every year?

Sure, we want to create norms and benchmarks so we can see what has changed and where we’ve improved. But how could it possibly be that we were so incredibly smart that THIS 30-minute tracker is precisely, exactly what we need forever and always?

  • Perhaps today is a great day to change it into three 10-minute questionnaires so that people can remain fully engaged through-out and not worry about finishing in time to pick-up their kids.
  • Perhaps today is a great day to remove the 10 minutes of questions that we’ve never acted on.
  • Perhaps today is the day we throw the whole thing in the recycle folder and brainstorm a completely new, far more engaging and actionable way to ask about our brand.


Why do we always default to questionnaires/groups/social listening?

Sure, we’ve written so many questionnaires that we’re experts at it. We could write a 30-minute questionnaire in 20 minutes. So how come someexpert researchers have never written one?

  • If you’ve never personally participated in a focus group, maybe now is the perfect time to try one so you can truly dig deep into the psyche of your buyers and users.
  • If you don’t trust biometrics, why not try one study just to prove yourself right – or wrong.
  • Why not take a class in interviewing or moderating so you’ll be just as comfortable defaulting to qualitative research when that method better suits the research objective?
  • Why not build a better tool box so you’ll be able to gather the precise insights you need rather than the insights that happen to be available at that moment?


Why do we always use the same sample sizes?

How is it statistically possible that n=300 is the best sample size to choose a nice color for a package and also the right sample size to choose a drug that will save 5 out 100,000 lives rather than just 4?

  • You may not like statistics but maybe the true statement is you don’t like statistics yet. Finding the right instructor can make all the difference.
  • Have you learned in detail what effect sizes are and how they affect sample sizes? Maybe 300 is correct, but maybe you actually only need 200.
  • Have you tried running the exact same study twice but with sample sizes of only 30? Seeing just how different those results are is a good reminder that random chance is real, and reliability and validity are important for generating actionable recommendations.
  • Have you tried generalizing research findings from a community survey of 30 Black people to 300 million white people? Over-sampling under-represented people is not a luxury – it’s a necessity.


There are so many good reasons to create time-saving templates and cognitive rules, but also so many reasons to ignore them. You need to ensure you’re making the choice for yourself rather than defaulting to a template for reasons of speed. That’s how we end up making great decisions.


Podcasts You Might Like


New from E2E Research! InscribeE Digital Signatures for Researchers and Business Leaders
By E2E Research | July 26, 2022
Are consent forms slowing you down?


Say hello to Inscribee!


Most businesses have moved their standard contracts, including NDAs, MSAs, and SOWs, from paper and pencil signatures to digital signatures. Electronic or digital signatures are secure, legally binding, and traceable. And, they speed up business processes immensely.


We can easily do the same with research participant consent forms, whether in-person or online. For fieldwork managers and vendor managers, digital signatures are particularly convenient for handling lots of forms across multiple projects and facilities. Rather than trying to store reams of consent forms and other paper contracts in filing cabinets or gigabytes of files across multiple client folders, digital signature tools allow you to prepare, maintain, and track thousands of contracts in one spot.

.
.

How can market researchers benefit from Inscribee?

In order to encourage openness and honesty from participants, researchers want the research experience to be as personal and friendly as possible. However, we also need to ensure that both the researcher and the research participant understand what will happen and what is expected of each party. Even though they feel formal and sometimes off-putting, contracts are unavoidable. What we can do is make sure the contract process is as simple and straightforward as possible.

  • Decorative imageMid-Survey Consent: Researchers often need to gain consent during the survey experience. However, traditional signature tools require participants to exit the survey, check their email, complete a form, email it back to someone, and then return to the survey. Ultimately, this leads to unnecessary dropouts as some people will simply quit or get distracted never to return to the survey. By embedding Inscribee within a questionnaire, participants can remain in the questionnaire throughout the entire research experience. You can collect hundreds or thousands of consent forms without forcing participants leave the survey.
  • In-Person Consent: When people participate in mall intercepts or visit central location facilities to participate in focus groups, interviews, or other in-person events, researchers can avoid creating mounds of paper work by using Inscribee digital signatures. Inscribee allows the research team to collect signatures on the spot even if participants don’t have their own data-enabled digital device with them. Participants sign the document digitally on your device, whether that’s a mobile phone, tablet, or desktop computer. Participants can also provide an email address where they will receive the fully signed document.
  • Reinforce Confidentiality: It’s nearly impossible to ‘force’ research participants to not share confidential information about products or concepts they see during research. However, creating a legally binding contract is a professional way to remind participants that the only way brands can continue to invite them to participate in these kinds of research projects is if they maintain confidentiality. A short one-page document signed by the research participant midway through a research study can remind them of what they agreed to prior to participating in the study.
  • Supplementary Consent: Some exercises completed during a research study may require additional consent beyond what was originally planned. Perhaps you’ve decided to incorporate a video or audio question and need to confirm that participants understand how that data containing PII will be used. Or, perhaps a segment of people may be asked to participate in a follow-up interview. Inscribee can be embedded into the questionnaire prior to the supplementary ask to gain appropriate consent in a convenient way.


.
.

How can business leaders benefit from Inscribee?

On top of being great for research fieldworkers and online questionnaire researchers, Inscribee simplifies the contracting process for business leaders, people leaders, and business development executives. It offers a full range of flexible features.

  • Supports traditional PDF documents such as NDAs, SOWs, MOUs, MSAs, and SLAs
  • Supports documents requiring one signature or many signatures
  • Supports documents requiring multiple signatures within one company or across many companies
  • Supports documents where the signees names and email addresses are known or not known
  • Can be easily embedded onto websites to accept signatures from hundreds, thousands, or millions of website visitors, users, or customers
  • Traceable, real-time tracking of signatures
  • Accepts signatures on any internet enabled device without downloads or registrations

From pitch to repurchase, Inscribee speeds up and simplifies signature processes for business leaders.
.
.

.
.

Comprehensive

document management

Credentials and

Technical Specifications

  • Easy document management on both mobile and desktop devices
  • Unlimited number of documents
  • Automatic invitations, reminders, confirmations, and notifications
  • Document sharing with other account users
  • Standard and customized fields and branding
  • Bulk email uploads and sending
  • Easy to deploy in any survey scripting tool including Qualtrics, Confirmit, Qualtrics, Decipher, Sawtooth and more
  • Mobile-first, device and browser agnostic
  • Legally binding mobile/digital signatures via emudhra, a registered certifying authority
  • Proprietary software developed by E2E Research, an ESOMAR corporate member and ISO 27001 certified company

Click here to start your first free Inscribee document now!

Annie Pettit Joins Thor O. Philogène on the Consumer Insights Podcast
By E2E Research | July 12, 2022

Decorative imageI recently joined Thor, Founder and CEO of Stravito, on his brand new Consumer Insights Podcast. We chatted about why market and consumer insights are important and how companies can use them, as well as how insights will be used in the future. And, I shared one of my favourite examples of how Lego used research to emerge from their slump.


Click here to have a listen on Spotify or on bcast.fm, and feel free to share your thoughts!

Market Research for Startups: In-depth interview questions to ask during the conceptualization phase
By E2E Research | May 17, 2022

Are you launching a start-up? Then I bet you have hundreds of questions about your potential product and your target audience.


From conceptualization to market sizing and scaling, innumerable questions must be answered in order to build a solid foundation for a successful business.  Fortunately, a full range of qualitative and quantitative research, primary and secondary research, and data analytics solutions exist to help you discover actionable answers to those questions throughout the entire process.


During the initial conceptualization stage, you’ll need to gain a comprehensive and unbiased understanding of the problem and potential solutions. You’ll also need to understand the tangents, side-conversations, and unspoken truths and myths that people won’t necessarily share with just anyone. To gain these types of insights from your target audience, qualitative research will be your go-to method.


Numerous qualitative techniques can help you at this point so let’s start by learning about in-depth, individual interviews.


What are individual interviews?


In-depth individual interviews IDIsAs the name suggests, individual interviews are in-depth conversations between a trained moderator and one other person. If the product or service is specifically designed for 2 or 3 people to use together, dyads or triads with colleagues, best friends, children, partners, or spouses may be used as well.

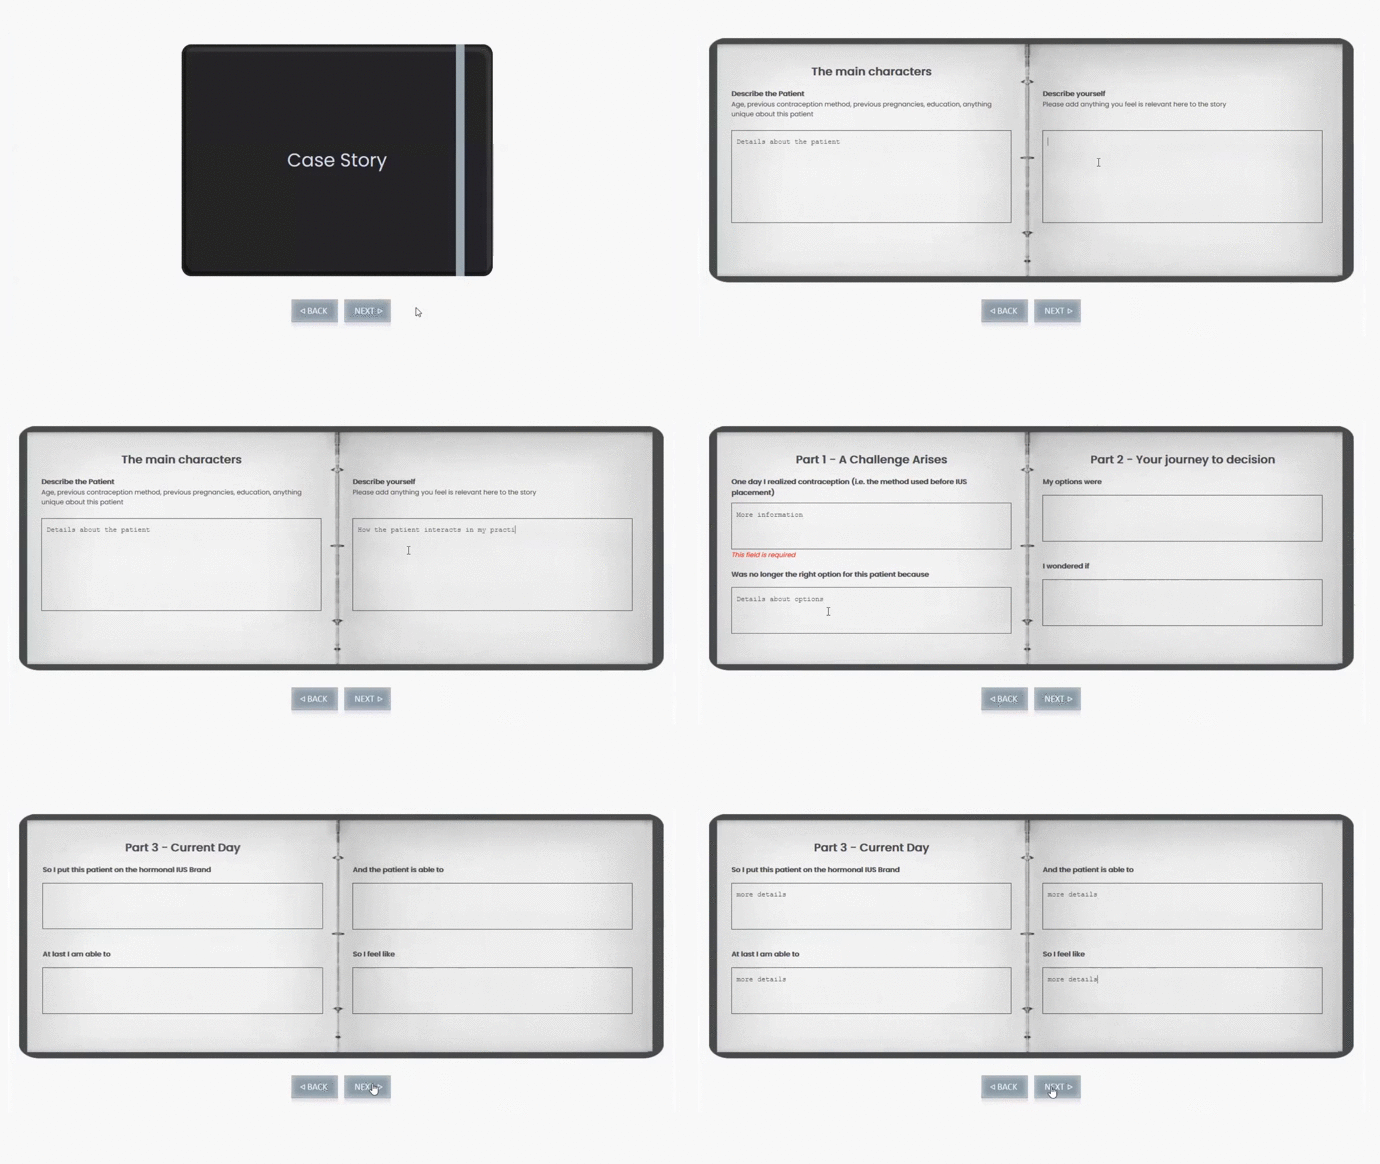
 

Key to this technique is working with a trained moderator. Although everyone has experience chatting with consumers, customers, or clients on a one to one basis, a research interview is completely different from a “chat” or “conversation.”


Trained moderators have unique skills which include understanding and responding to the body language of the person they’re interviewing. They have learned how and when to use specific language to encourage someone to share more detailed and personal insights. And, most importantly, they actively strive to prevent bias from unconsciously creeping into a conversation.


Interviews are an excellent way to deeply connect with your target audience and get a first-hand look into their emotional and physical real world. Interviews will allow you to:

  • Spend meaningful time with them such that they open up about their personal habits, behaviors, needs, drivers, emotions, and opinions.
  • Watch and listen to them struggle using unsuitable, existing products and services in their real world, whether that’s in their home, school, office, or gym.
  • Watch and listen to them as they attempt to shop for alternative products using both online and offline channels.

These observations will guide you towards a thorough and unbiased understanding of what the problems and required solutions really are.


What follows are key questions that an interviewer might address during the initial, conceptualization stage.


How are people emotionally connected to the problem?

  • How do you feel about this situation? What types of emotions do you have dealing with this situation? How strong are those emotions?
  • How does this situation interact with different aspects of your life – at home, at work, with your kids or parents?
  • How do you feel about the available alternatives or lack of alternatives? How do you compensate for the lack of easily accessible alternatives?
  • What is your emotional state when you really need an alternative and can’t find one?
  • How do your personal finances and resources fit into finding alternatives?


Who are the primary and secondary stakeholders?

  • Who uses or needs the product? Who else might use it if they saw it lying around? Who would do the shopping for it? Who would approve and pay for it? Who would ensure the product gets used? Who would help you use the product and how would they help you use it?
  • What frustrations and pain points do you have during the situation? What are the pain points of people who must find alternative options and pay for alternatives for you?
  • Who is negatively and positively affected by this situation being unresolved?


What alternative solutions are being used now?

  • What compromises do you make regarding this situation?
  • What do you wish you could do? How would you solve the situation?
  • How do you find and learn about potential alternatives?
  • How do you physically manipulate or use current products? What other items do you use the product with? What do you buy to support using the current product?
  • Where do you use current and alternative products? How do you use them?
  • Where do you store current products and packages? What are your fears about storing them?


What’s Next?

During the conceptualization stage, your main goal is to listen and understand the problem without bias. You need to truly hear people and learn about their personal experiences so that you can identify both major and minor problems that may need to be solved. Individual interviews are the perfect solution for understanding people’s most intimate perceptions and behaviors. You’ll build a broad and deep baseline for what the key problems are and the range of major and minor issues that need to be resolved.


If you’re ready to deeply understand your target audience with individual interviews, please get in touch with us. We’d love to help you grow your start-up into a successful business! Email your questions about gathering information to support your startup to our research experts using Projects at E2Eresearch dot com.


Learn more from our case studies


Podcasts You Might Like


Books You Might Like


Conferences You Might Like


How to generate more insightful reports
By E2E Research | April 11, 2022

Decorative image
We keep hearing that slow food is better food. It seems to me that the same thing applies to marketing research reports.


At its heart, the intention of slow food is to promote local products and traditional methods, to focus on quality over quantity, and to prevent over-production and waste.


Those key concepts are just as relevant for research reports. Rather than focusing on fancy ways of reporting, focus on effective ways of reporting. Rather than focusing on providing pages and pages of results, focus on the most important results, and rather than focusing on creating extravagantly detailed results, focus on creating insightful results.


Let’s break this down a bit more.


Statistical significance isn’t important

You heard that right. While focusing on statistical significance is a fast way to find cool numbers to slam into a report, I often don’t care about it. If 5% is statistically different from 6%, it’s not important unless that 1% difference is actionable and meaningful. In healthcare, 1% can be life or death and I will care enough to consider replicating the results – immensely. But when it comes to choosing a package design, that 1% is sampling error, analysis error, random error, meaningless.


Instead of being driven by shiny, statistically significant p-values, slow down and think through which numbers are meaningful and actionable. Which numbers will create reliable and measurable differences in the market. Once you’ve decided that a significant difference is meaningful, then you can worry about it. And if something is significant but not meaningful, put it aside to think about potential applications later.


Every title should be a conclusion

Page and chart titles can be really easy to write. Pick out the biggest or smallest number on the page and copy it into the title space – “45% of participants chose concept B.” Done and done! But that’s a report no one will care about. It won’t get shared with the leadership team and you won’t be asked (or paid!) to write next year’s report.


Instead of focusing on data points, focus on what was learned on a specific page. Slow down and take the time to digest the 5 or 50 data points on the chart or table. What story does the collection of data points on that single page tell? What is surprising about the interactions among those data points? What is the overall conclusion based on the themes of answer options? What is the key recommendation you would draw from that page? The biggest (or smallest) number is often not the important story. But once you slow down to figure out what the real story is, then you’ve got a great page title.


Alphabetical is never the right order

When we write questionnaires, we order the questions in terms of what makes sense to the research participants reading each page. From the researcher’s point of view, it would be really fast to create a final report where page 1 is a chart for Question 1 and page 100 is a chart for Question 100. But that type of reporting is nonsensical to readers. Indeed, some questions are superfluous – they are there to focus participants’ attention or to direct them to a certain line of thinking.


Every study is designed to answer very specific research objectives and those objectives should be top and front of the research report, not buried in alphabetical order. Take the time to think through which questions provide a holistic answer to Objective 1, and prepare those together at the beginning of the report. Even if that means analyzing questions 17, 43, and 96 together – out of order!


Once you’ve understood all of your data and the results, reorder all the slides (and then edit all the titles) so they tell a logical story from beginning to end that reflects the research objectives. Forget the order of questions and focus on the order of the story.


Every header in the executive summary is one sentence of the full story

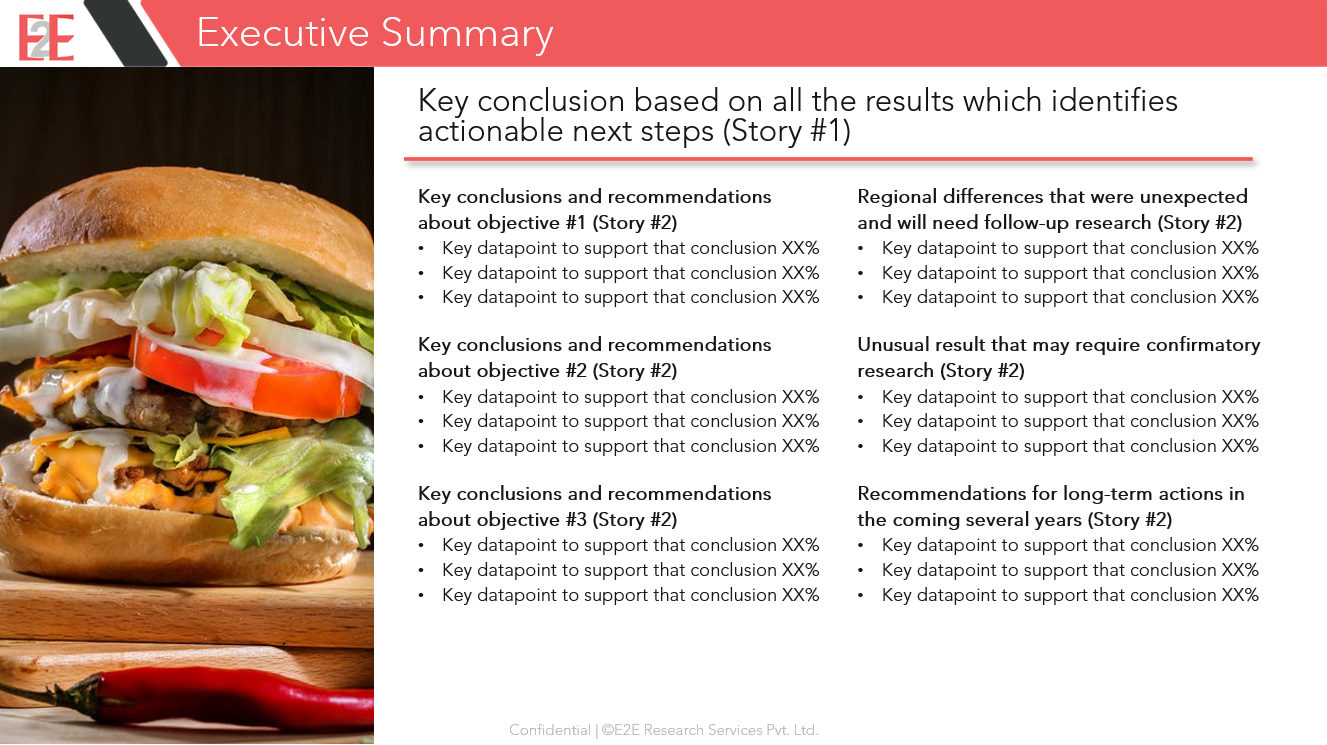
Once you’ve created your 20 (or 50) page story, it’s time to build the executive summary. These are never just a listing of the coolest data points. As fast as that is, you’ll once again end up with a report that lands in the recycle bin with nary a forward email. With a fully written, reordered, and edited report in hand, you need to create an executive summary that serves the needs of different key stakeholders.

  • First, the CEO and CMO should be able to read the title of the executive summary and know exactly what their next business move should be next year. That is story #1 – punchy and obvious.
  • Second, the VP of Brand or Insights should be able to read only the headers of the executive summary and know how to plan for this year. That is story #2.
  • Third, the Brand Manager or Insights Manager should be able to read all of the bullet points in the executive summary to plan for tomorrow.


Your goal is to ensure that each key stakeholder can read as little as possible to get their job done. Of course, if you’ve gone slow and taken the time to write an amazing report, you might just find that all of your stakeholders have read the entire executive summary and every other page as well!

Decorative image


Highlight oddities

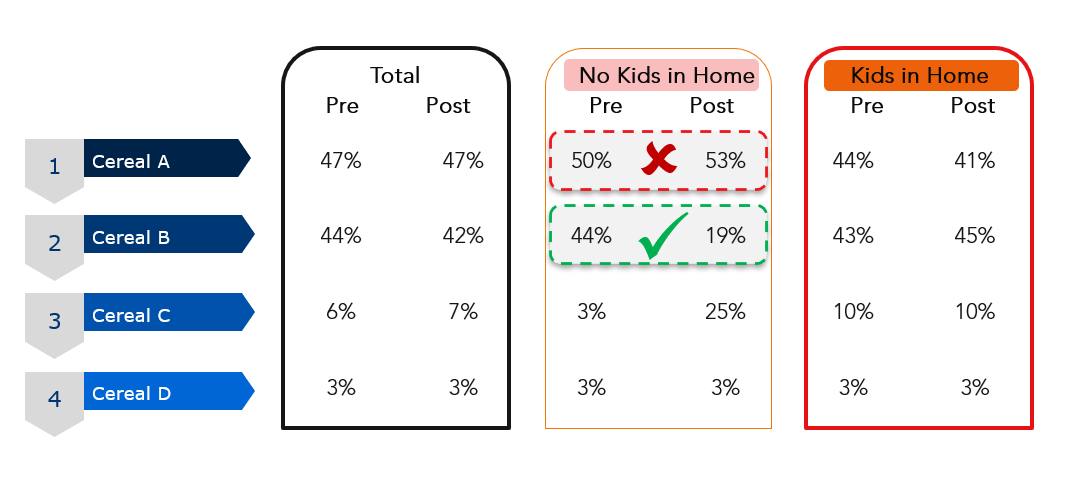
The fastest way to finish illustrating every slide is to use call-outs and arrows to highlight the smallest and biggest numbers, the winners and losers, the leaders and the laggards.


But, we already know this serves no purpose. It’s not helpful and it’s not insightful. Any reader can glance at a chart or table and instantly see what is at the bottom or the top of the list. X does not mark the spot!


Your job as an analyst and report writer is to take the time to read between the lines and find the hidden treasures. Which number is sneaking by in an unexpected place? What trend is the reverse of expected?


Highlight that oddity so your reader doesn’t have to waste time searching out what you already described in writing. The green outline here saves the reader time by drawing their eyes immediately to the interesting data point. If they want to look at the top and bottom or left and right of the chart as illustrated by the unhelpful red box, they can easily do that too.

Decorative image


Embrace white space

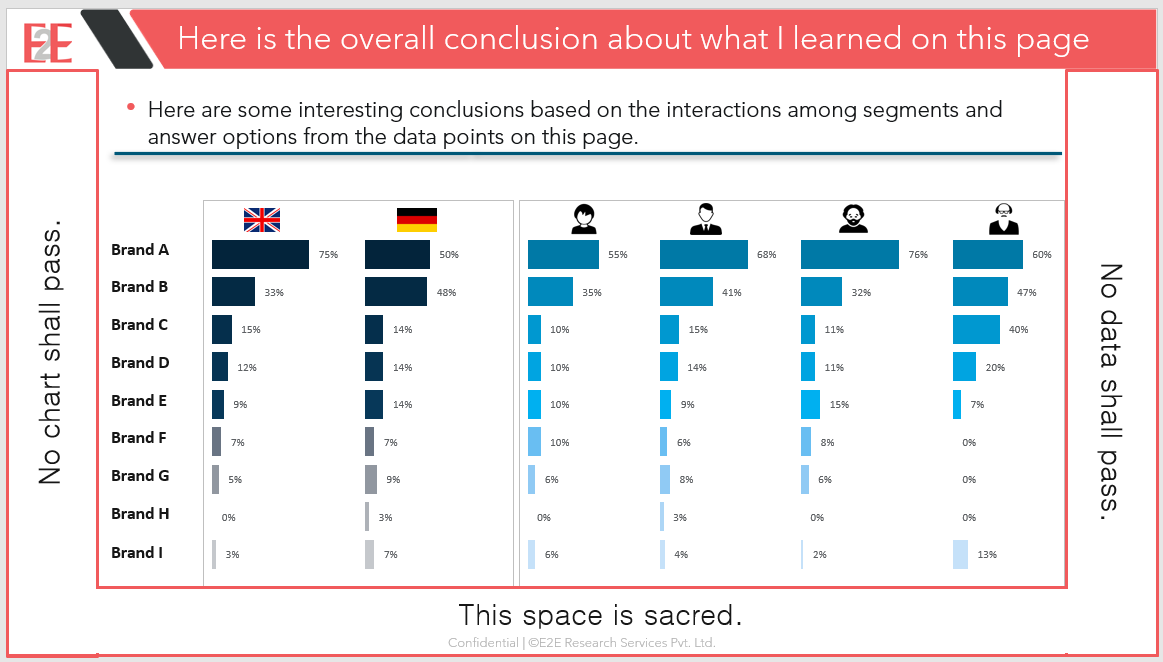
Sometimes, you’ll need to incorporate an extremely complex chart that has lots of answer options or segments. It would be quick to just stretch the borders to so that it is really tall or wide. You must resist the urge!


Treat the white space around the edge of a slide as sacred, never to be infringed upon. That white space creates breathing room for the eyes. It makes charts and tables easier to read, moreso than stretching charts out wider across the page.


If a chart or table simply won’t fit, find other ways to make complicated charts easier to read. Convert it into two charts – perhaps organized by segment or outcome or culture.

Decorative image


Never use default charts

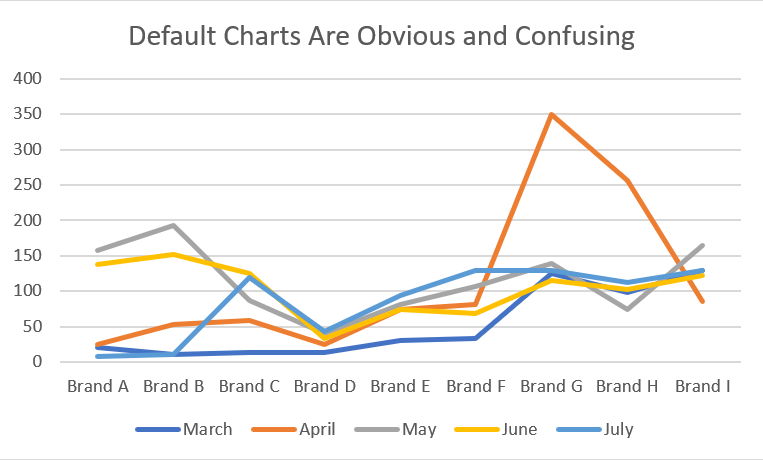
It sure is fast to use default charts. The fact that everyone can spot them from a mile away is not the reason to stop using them though. If you take the time, default charts can always be improved to highlight the results in a more valid and insightful way.


Take the time to ensure the axis starts at 0, not -5. Reduce the number of guiding lines to just 2 or 3 – or even none! Simplify the colors or, at least, convert them from florescent to neutral so you don’t burn your readers’ eyes. Make sure the colors or textures of the lines are different enough that people who are color blind can read them – Is there even a difference between March and July in this chart? And, is this even the right kind of chart?

Decorative image


Refuse to use chart junk

Sometimes, a slide needs to be prettied up. Perhaps you’ve got 5 slides in a row that are text after text after text. It’s time to introduce some design and get the eyeballs back on track.


However, this is NOT the time to drop in all of your favorite cute clip art icons. This is the time to consider what is the story you want to tell and does that story require clip art – the answer is most often no. Clip art is the PPT user’s version of chart junk (Thank you Edward Tufte for that term!).


Instead, opt for subtle designs that don’t detract from the message. Or, use photographs as you see in the executive summary above. Plenty of websites offer free images, e.g., Pexels, Pixabay, Unsplash. And if those sources don’t provide the diversity you need, there are additional sources such as Disabled and Here, Jopwell, and Nappy.


What’s Next?

We’d love to show you what a great report looks like. If you’re ready to discover top quality insights about your buyers, brands, and business, email your project specifications to our research experts using Projects at E2Eresearch dot com. We’d love to help you turn your enigmas into enlightenment!


Learn more from our case studies


Learn more from our other blog posts


Books You Might Like


Conferences You Might Like


What is brand equity: Importance, benefits, tips, and examples to build a more successful brand
By E2E Research | March 7, 2022

What is brand equity?

Think about a brand you absolutely love – a store you can never wait to go to, a product that makes you grin just thinking about it.


Now think about brands you absolutely hate – a product or company that makes millions of people roll their eyes and groan with disgust.


That’s brand equity! Or lack thereof.


Brand equity is a complex construct. At its core, it’s a subjective perception of a brand’s value, quality, performance, and personal relevance. It incorporates consumer perceptions related to the product and its packaging, presentation, mission, vision, and values.


An easy way to think about brand equity is that it’s the difference in price and preference between an unbranded (or store brand) product and a branded product. Even though they’re the exact same thing – soda, butter, oil, beef, corn, eggs, many people will choose the brand name version because of the higher value they perceive it to have.


It can take a long time to build brand equity but one wrong move and it can be destroyed in seconds.


Why is brand equity important?

There are many benefits to building brand equity, and collectively their benefits are massive.

Decorative image store brand and starbucks coffee cups

  • Premium pricing: One of the key benefits of high brand equity is the ability to charge premium pricing. When people believe in and love a brand, they will pay more for it. Coffee is coffee but people will pay more for coffee that comes in a cup with a Starbucks brand on it, a name they know and trust. That higher price leads to higher profits which, of course, leads to greater financial success.


  • Low price elasticity: When people value a brand, they are more likely to purchase that brand even in competitive situations. High equity brands don’t have to worry as much that competitive brands will ‘steal’ their customers with a great BOGO or intriguing offer. And, they don’t have to spend as much time and money creating offers to convince competitive buyers to try their products.


  • Customer lifetime value: When brands create high equity, their customers are more loyal to the brand and purchase more of their products over a longer time period. Even better, those loyal customers are more likely to try new products created by the brand, whether in the same or other categories. The trust has already been built and customers don’t have to overcome the fear of trying a new brand. They simply need to determine whether the new product meets their needs.


  • Market resilience: Products with high brand equity are more likely to endure during uncertain circumstances. When environmental, social, and political events necessitate a change in purchase and behavioural patterns, people will still try to retain consistency in their lives. High equity brands offer consistency, trust, and reliability when consumers need it most.


  • Market power: As a high equity brand that people trust and desire, you have increased opportunities to attract and demand the best. Your demonstrated power in the marketplace means you can attract the best employees, the best suppliers, the best investors, and also negotiate the best prices and rates.


How to Build Brand Equity?

Brand equity can take a long time to build. However, there are a number of strategies and tactics that companies can leverage to get there. The key is playing the long game.

Decorative image customer journey mapping

  • Understand consumer needs and values: By understanding what consumers truly want and need, you can ensure your products and services are relevant to them. Take advantage of quantitative questionnaires and qualitative focus groups and interviews to understand customer journeys, gaps and pain points, customer personas, and customer segments. Dig deep to uncover their physical, emotional, social, psychological, environmental, and spiritual needs so that you can discover what might convert them from casual tryers to long-term, loyal advocates.


  • Understand product differentiators: Not only do you need to understand your buyers and prospects, you need to understand what attributes elevate your products and services ahead of your competitors. Primary and secondary research will help you understand the competitive marketplace, market positioning, innovation opportunities, or opportunities for product optimization.


  • Fine-tune your messaging: Once you understand your consumers and your products, ensure your messaging is in alignment. Primary research will help you ensure your product messaging and campaign research focus on messages that resonate with your customers and address their key values, unmet needs, values, and pain points.


  • Deliver on promises: It may sound easy, but delivering on your brand promise is tough. Most brands have many disparate channels, all of which need to present your brand and your products in an unrelentingly consistent way. Whether in-store, on the phone, or online, your brand’s character, values, and vision must drive every customer interaction and business decision in a consistent way.


  • Foster loyalty: It’s important to foster loyalty among your existing customers. Pay attention to your most loyal customers and create opportunities to reward and encourage them. Give them reasons to continue loving your brand whether that’s special offers or enhanced customer service.


 brand logos with no brand names

  • Drive awareness: If you’ve been paying attention to the animated image to the right, you’ve probably been able to name the brand behind every single logo. Despite the fact that not a single brand name is shown. This is brand equity. And this is the level of brand awareness that every brand ultimately strives for. When your customers and prospects recognize your brand colors and shapes, it’s far easier for them to find and choose your brand off the shelf, virtual or physical. Run carefully targeted advertising campaigns on a variety of relevant channels that focus on your benefits, stories, and value to help consumers learn, and connect your messages and your branding. Try a variety of relevant tactics such as influencer marketing, celebrity endorsements, or event marketing.


  • Create positive customer relationships: Customer experiences are no longer confined to the physical store. Brands need to create positive experience across every physical and digital touchpoint including their own online stores and social media channels like Twitter, Instagram, and TikTok. Pay attention and respond quickly to customers sharing their opinions on review websites like Amazon, Foursquare, and Yelp.


Positive brand equity vs. negative brand equity

When people pay more for a brand even when there are equivalent yet lower priced brands available, that’s positive brand equity.


But, when people avoid or ignore a brand, even when it’s pricing is very competitive, that’s negative brand equity. For some companies, negative brand equity can destroy a brand such that consumers quickly forget it ever existed. For others, the negative equity is fleeting and at least somewhat recoverable.


Decorative image amazon brand equityAmazon: Since starting up as a book seller, Amazon’s focused effort on meeting customer needs has resulted in amazing brand equity. Because of their unquestioning return policies, unending selection, and ability to get product in hand in mere hours, customers are fiercely loyal. That’s positive brand equity.


Decorative image apple brand equityApple: Apple is another great example of a company with positive brand equity. Their customers are massively loyal. Even though Apple products are known to be pricey, customers line up every time a new product is released even if their existing product still works great. Customers trust the quality, reliability, and functionality of Apple products and remain loyal customers for years. Why? Because Apple focuses on creating innovative, self-explanatory products that meet customer needs every single time.


Decorative image chipotle brand equityChipotle: In 2015, Chipotle experienced a food poisoning crisis which led to a $25 million federal fine. After years of positive growth, that crisis caused the brand value to decline sharply. It was several years before they managed to regain consumer trust, and recover and grow their brand value. This is a great example of positive brand equity turned negative and then reverting to positive again.


Decorative image mcdonalds brand equityMcDonald’s: Though McDonald’s has been the #1 burger chain for years, they struggle with ongoing negative brand equity. Customers and consumers have complained about unhealthy food options for decades, and that perception seems relenting no matter how McDonald’s tries to head it off.


Decorative image starbucks brand equityStarbucks: Want some high-priced coffee? Well, Starbucks customers are willing to pay a premium because they love the high-quality product and they love the top-notch customer experience – even when their name is accidentally (deliberately?) misspelled on their cup. Whether you’re a customer or not, everyone immediately recognizes the logo of this high equity brand.


Decorative image toms shoes brand equityToms: People love the Toms shoe company. Why? Not only do they make a great shoe, they donate a pair of shoes with every purchase. This human centered value makes customers feel good about their purchases, and keeps them coming back again and again to support a company that matches their own values.


How to Measure Brand Equity

Because brand equity is so multi-faceted, measuring it isn’t simple nor templated. It’s important to incorporate a range of relevant quantitative and qualitative metrics, as well as financial and market assessments to gain a holistic view of brand equity.


Quantitative metrics: As part of a quantitative questionnaires, there is a wide range of questions that can be posed to consumers and customers to better understand your brand equity. As you’ll seen in the images below, these kinds of questions can be posed not simply as traditional radio buttons and checkboxes, but also as interactive, engaging image style questions.

  • Brand awareness: What three brands come to mind first when you think of washing detergent? What other brands have you heard of?
  • Brand perception: Which of the following words reflect how you feel about this brand of washing detergent?
  • Consideration: On a scale from 1 to 10, how likely are you to buy the following brands of washing detergent the next time you go shopping?
  • Loyalty: On a scale from 1 to 10, how likely are you to recommend the following brands of washing detergent to your friends or family?
  • Loyalty: How often do you buy the following brands of washing detergent?
  • Trial: If this brand of washing detergent were to release a fabric softener, how likely are you to try it?
  • Customer experience: On a scale from 1 to 10, what is your opinion about the customer service you received from our online chatbot or our social media or telephone representative?

E2E Engame question animation E2E Engame question animation

.

.

Qualitative metrics: Of course, there is far more to measuring brand equity than focusing on quantitative questions. Focus groups, interviews, and other qualitative tools like online communities are also excellent ways to measure brand equity.  By combining qual and quant methods, you can gain a more holistic view of this subjective construct. Here is a sample of some types of questions and tasks to incorporate in qualitative research, again with a couple examples of how more qualitative questions can be incorporated into traditional online measurements.

  • What is your opinion of this logo and imagery?
  • Describe 3 things you love about this brand and 3 things you hate about this brand.
  • Why do you buy the following brands of washing detergent?
  • Why would you choose one brand of washing detergent over another?
  • Which of the following images reflect how you feel about this brand of washing detergent? Tell me why.
  • If this brand of washing detergent was a person, how would you describe it?

E2E Engame question animation E2E Engame question animation


Behavioral/transactional metrics: Financial and company metrics are also extremely important for understanding brand equity.

  • Company metrics: What is the value of the company, and is it increasing?
  • Brand metrics: What is the market share of the brand, and is it increasing? What is the profit of the brand, and is it increasing? What is the price difference compared to generic brands, and is it increasing? What is the purchase volume and frequency for the brand, and is it increasing?
  • Employee metrics: What is the cost of employee acquisition, and is it decreasing? What is the average tenure of an employee, and is it increasing? How many applications per open position are received, and is it increasing?
  • Customer metrics: What is the cost of customer acquisition, and is it decreasing? What is the average tenure of a customer, and is it increasing? How many customer complaints are receiving during a specific time frame, and is it decreasing?


What’s Next?

Are you ready to discover top quality insights about your brand and grow your brand equity? Email your project specifications to our research experts using Projects at E2Eresearch dot com. We’d love to help you better understand your buyers and your brand to help you turn your enigmas into enlightenment!


Learn more from our case studies


Books and Videos You Might Like