Request a quote!

Blog, News &

Case Studies

A Beginner’s Guide to Usage and Attitude Studies
By E2E Research | January 11, 2023

Ah, a rose by any other name smells just as sweet! Roses? Well, instead of using the phrase Usage and Attitude, you might hear some people use the phrase Habits and Practices. And instead of shortening it down to U&A, they’ll shorten it down to H&P. Whether you’re interested in a U&A or an H&P, we’re generally talking about the same thing. Use the acronym you prefer and we’ll all gain more valuable insights into consumer behavior, attitudes, and usage patterns.


What is a Usage and Attitude Study?

Decorative imageUsage and Attitudes studies aim to understand a broad range of behaviors and attitudes related to the people experiencing a product or service. It’s relevant for all products like food, beverages, hair care, and electronics, as well as services like healthcare, banking, and education.


Most U&As gather information about the brand of interest, as well as competitive brands and the category as a whole. This ensures you gain a full understanding of any behaviors and attitudes that could eventually be relevant and important to the brand of interest.


Why is a Usage and Attitude Study Important?

U&As create a solid foundation for building a brand. They serve a number of important benefits in a variety of key areas.


People: Know your buyer and your consumer
  • Create more relevant and memorable messaging by understanding the unique demographic and psychographic characteristics of each segment of users that has been identified in any segmentation research you’ve conducted
  • Understand purchase drivers associated with each persona, e.g., price, availability, loyalty, packaging, sensory features, sustainability, durability
  • Plan for the future by identifying what each segment needs and wants from an ideal product
  • Differentiate between the needs of buyers (e.g., availability, pricing) and users (e.g., efficacy, sensation), and ensure the targeted message reaches each audience


Place: Know your buyers’ preferred information and purchase channels
  • Focus your marketing spend in the most effective channels by identifying the marketing and sales channels and influencers that are most effective and important at each stage of the purchase journey


Pricing: Know your buyers’ preferred pricing models
  • Create the most effective pricing model by understanding attitudes towards various pricing strategies, e.g., every day low pricing vs sales vs bundling


Promotion: Know your buyers’ preferred promotion tactics
  • Create the most effective promotion model by understanding which types of promotions are relevant for your buyers, e.g., in-store promotions, OOH promotions, door-to-door promotions


Product: Know what your consumer needs and wants from your product
  • Prevent switching and abandonment by identifying and resolving frustrations, complaints, and pain points
  • Encourage purchase by identifying and reminding people of desired benefits and advantages
  • Plan product improvements by understanding which product features people love and hate


Strategy: Know how to position and plan for the future

Decorative image


What Questions to Ask in a Usage and Attitude Study

Decorative imageAs with any research project, there is an unlimited number of questions that could be asked. The key is to identify the specific research objectives for the imminent research project and focus the questions there.


Then, select a set of engaging questions that will keep the entire questionnaire to less than 15 minutes long. Don’t try to do everything or the data quality will suffer.


Brand Metrics
  • Awareness: When you think of this product category, which brands come to mind first?
  • Aided Awareness: From this list of brands, which ones have you heard of?
  • Discovery: How did you first hear about this brand?
  • Trial: Which brands of this category have you ever tried?
  • Trial: Why did you decide to try this brand?
  • Consideration: When you think of this product category, which brands would you consider buying?
  • Consideration: From this list of brands, which ones would you considering buying?
  • Preference: When you think of this product category, which brand do you most prefer?
  • Loyalty: If your preferred brand was not available in your usual store, what would you do?
  • Perceptions: Which 5 of these words reflect your opinions about this brand?
  • Perceptions: What 3 things do you like about this brand? What 3 things do you dislike about this brand?
  • Perceptions: Which of these brands is most innovative? Fun? Likeable? Effective? Appealing? Different?
  • Perceptions: What is your opinion about the effectiveness of this brand? Quality? Appearance? Texture? Taste? Scent? Sound? Durability? Sustainability?
  • Perceptions: Overall, what is your opinion about this brand?


Product Usage
  • In your household, which of these people use this category?
  • In your household, who uses this category most often?
  • Where in your home is this category used?
  • At what time of day/week/month/year is this category used?
  • How is this category used?
  • What occasions is this category used for? Every day? Holidays? Religious days? Birthdays?
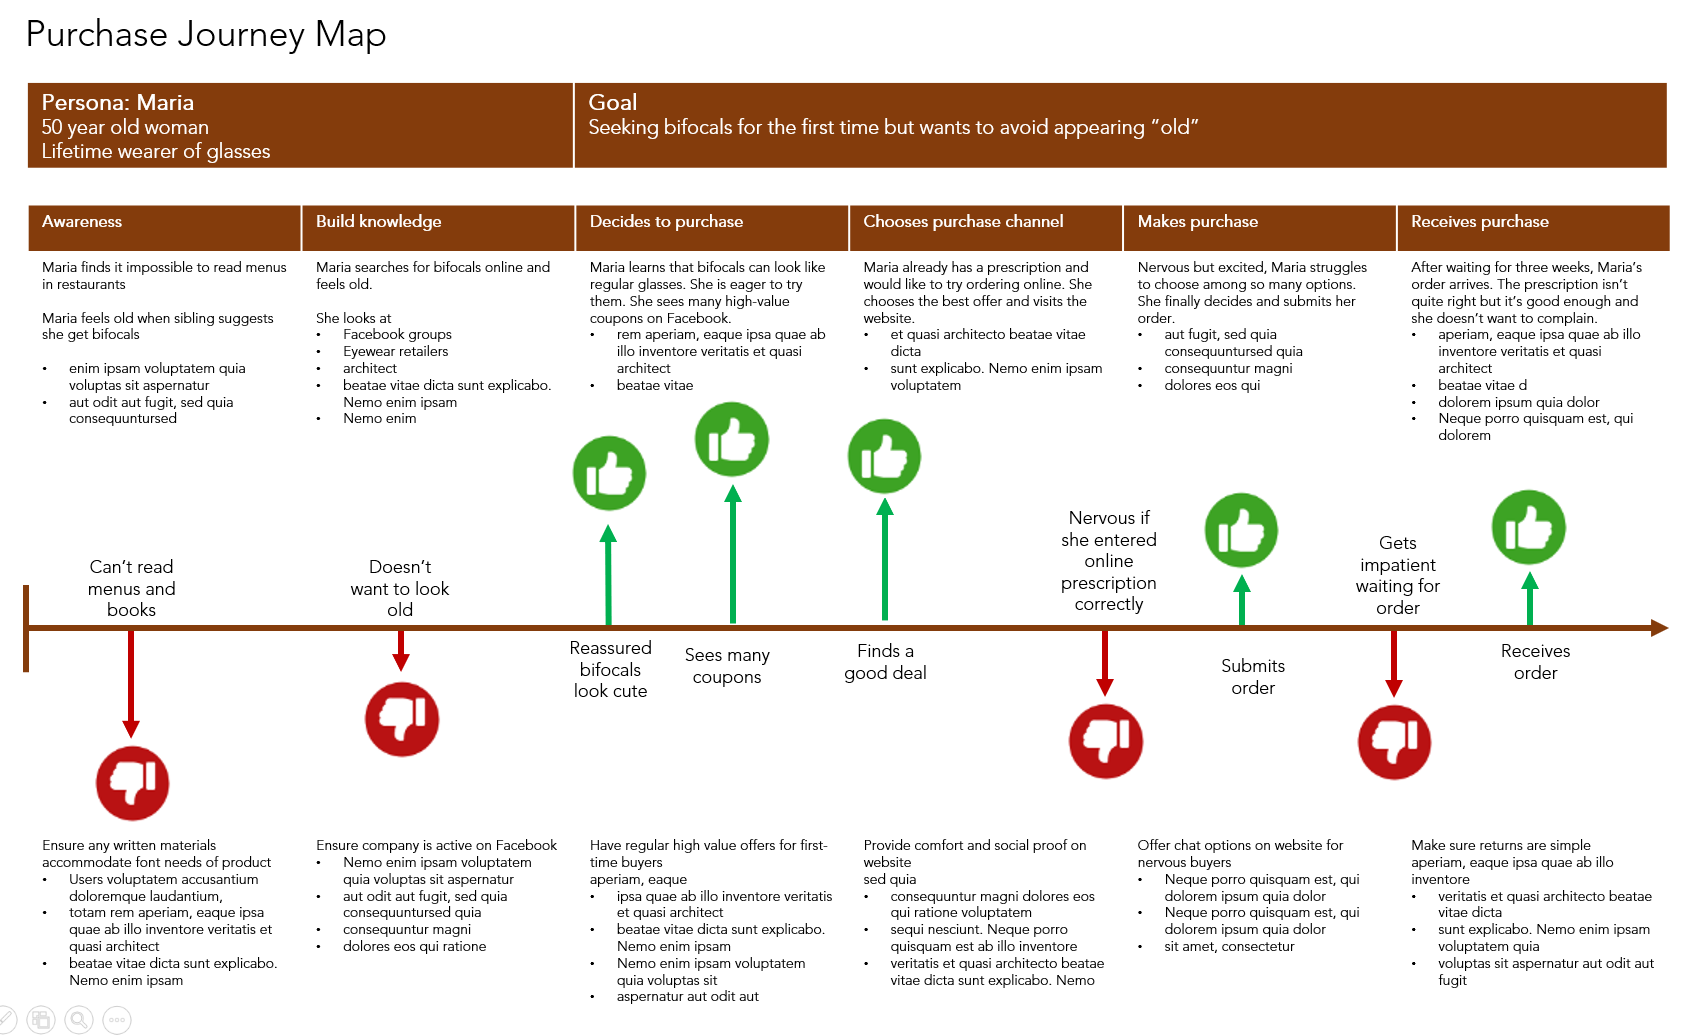


Decorative imagePurchase Journey:
  • Who usually buys the product?
  • What are all the places where this category/brand is bought?
  • Where is this category/brand usually bought?
  • Where do you prefer to buy this category?
  • On the next shopping trip, which brands will be bought?


Purchase Frequency / Recency / Monetary
  • How often is each of these brands bought?
  • How often is each of these brands used?
  • In just the last 7 days, which of these brands have been bought?
  • When was the last time each of these brands have been bought?
  • What size package of category/brand is usually bought? What size is preferred?
  • At what time of the day/week/month/year is this brand/category usually bought?
  • The last time this category/brand was bought, about how much was spent on it?
  • The last time this category/brand was bought, were any coupons or cost savings used?
  • What is your opinion about using coupons? Buying at regular price? BOGOs?


Personal Details
  • Demographics: Age, gender, income, education, ethnicity, religion, household size, children in home
  • Psychographics: Personal attitudes towards relevant category characteristics, e.g., sustainability, early adoption, pricing preferences


Why Ask About Behaviors that Can Be Measured Digitally?


Decorative imageIf time and money were no objectives, many metrics could be confirmed visually or digitally. Sometimes, however, it’s faster and easier to just ask people. Sometimes the data isn’t available in a properly formatted, readable database. Sometimes the data isn’t available for purchase. And sometimes, we need to match attitude data with behavior data for specific people.


Or, and this is much more interesting, maybe we want to understand what people think they are doing. The way people think about or recall their behaviors is an indirect measure of awareness, loyalty, believability, and likeability. If people can’t remember which brand they buy, whether the name or the logo, that’s not a great indicator of brand loyalty which could permit a premium pricing strategy.


What’s Next?

Most brands are well served to conduct a U&A study. If you’re ready to discover top quality insights about your buyers, brands, and business, email your project specifications to our research experts using Projects at E2Eresearch dot com. We’d love to help you turn your enigmas into enlightenment!


Learn more from our case studies


Learn more from our other blog posts


A Brand Manager’s Practical Guide to Brand Tracking
By E2E Research | December 14, 2022

What Is Brand Tracking

Brand tracking is a marketing research technique that takes measurements of a brand at regular intervals of time. The goal is to identify those things having positive or negative impacts on the growth of the brand and to make strategic changes that will improve its chances of success.


Brand trackers typically fall into three categories. Some focus on financial metrics such as customer, sales, market share, or price data and rely on business intelligence and data analytics. These studies typically use pre-existing, internal business data. Other trackers use behavior data such as website page clicks or search volumes.


Finally, some brand trackers rely on consumer metrics such as perception, opinion, and behavior data. These studies typically use questionnaires or user-generated social media listening data. Here, we will focus mainly on brand tracking using consumer metrics as measured by questionnaire data.


What are the Benefits of Brand Tracking

Brand tracking has many benefits for brand managers, marketers, and business leaders.


Trackers help brand managers:

  • Understand the perceptions a variety of target audiences or personas have about the brand in terms of what they think, feel, and do
  • Understand the pain points of each target audience
  • Identify the product features, messages, and channels that matter to their audience
  • Improve products and services in keeping with the needs and wants of their audience

Decorative image

  • Understand how customers position the brand within the competitive space based on product capabilities, pricing, and channels, etc.
  • Monitor the performance of competitors in terms of which ones to pay attention to because they are gaining or losing ground over their brand


Trackers help marketers

  • Understand how various target audiences as identified through segmentation research perceive and react to a variety of branding and messaging strategies
  • Identify and optimize under and over-performing marketing and brand strategies
  • Identify under and over-performing marketing channels that deserve or don’t deserve additional funding


Trackers help business leaders

  • Identify whether a brand is meeting, beating, or missing growth expectations
  • Identify concerns about a product, channel, or competitive brand before they escalate into problems
  • Discover opportunities for innovation


Key Metrics for Brand Tracking

Theoretically, there are unlimited questions that could be asked as part of a brand tracker. However, to ensure research participants remain engaged and can generate quality data, it’s important to focus on just a few key metrics. Here are some example questions to consider.


Brand Purchase: Brand purchase is one of the most important metrics to track as it reflects recalled behavior over perceptions. This is particularly important when you understand that people regularly buy things they don’t personally like because of cost or availability, or because those items are for other people. Keep in mind that, for some people, purchase could be more accurately described as trial – a one time purchase that they don’t plan to make again.

  • In just the last 7 days, what brands of product category have you bought? (Unaided)
  • In just the last 7 days, which of these brands of product category have you bought? (Aided)


Brand Repurchase: Like purchase, this metric reflects recalled behavior. In this case, it measures purchase of the brand on multiple occasions. Similar to brand purchase, repurchase could be an artifact of cost or availability rather than loyalty or brand love. However, repeat purchase is the goal of most brands.

  • The next time you go shopping, which brand of product category will you buy? (Unaided)
  • The next time you go shopping, which of these brands will you buy? (Aided)
  • Which of these brands do you buy most often?
  • Which of these brands do you buy at least once per month?


Brand Loyalty: Most brands are keen to create brand loyalty. People who are truly brand loyal are much less likely to switch to competitive brands even when they are more readily available or have more favorable pricing. This makes premium pricing a possibility.

  • If your preferred brand was not available in your usual store, would you buy a different brand, wait until your brand was available in your store, or go to another store?


Brand Preference: Brand preference indicates which brand people would choose if the appropriate situation arose. Remember that even though people may prefer a brand, they might never buy it if it’s not the right price, not available at their store, or disliked by other household members.

  • When you think of this product category, which brand do you most prefer? (Unaided)
  • From this list of brands, which one do you most prefer? (Aided)


Brand Consideration: When retailers offer a large number of brand choices, people may focus their attention on just a few of those brands. Your brand needs to be strong enough to stand out amongst all the competitive offerings to remain in that final consideration set. Again, consideration is not the same as purchase – someone could always keep a well-respected brand in their consideration set but never actually buy it.

  • When you think of this product category, which brands would you consider buying? (Unaided)
  • From this list of brands, which ones would you considering buying? (Aided)


Unaided and Aided Brand Awareness: Unaided awareness occurs when people are asked about brands in the category and they choose to name your brand. Aided (prompted) awareness is typically higher and reflects the percentage of people who recognize your brand in a list of competitive brand names or logos.

  • When you think of this product category, which brands come to mind first? (Unaided)
  • From this list of brands, which ones have you heard of? (Aided)


Brand Recall: Hours, days, or weeks after seeing your brand in a campaign or in the news, do people remember seeing it? High recall occurs when messaging is intriguing or relevant enough to generate notice and retention.

  • In just the last 7 days, what brands of product category have you seen advertised on TV? (Unaided)
  • In just the last 7 days, which of these brands of product category have you seen advertised on TV? (Aided)


Brand Perceptions: Brand perception metrics are far more nebulous than the previous metrics discussed. They generally reflect opinions, attitudes, and emotions people have about the brand, whether conscious or unconscious, and are typically measured via attribute batteries or lists of ideas. These metrics are most helpful at supporting or driving the other metrics.

  • Which of these words reflect your opinions about this brand?
  • What 3 things do you like about this brand?
  • Please explain the differences between Brand A and Brand B.
  • Which of these brands is most innovative? Fun? Likeable? Effective? Different?


How Often Should You Run a Brand Tracker


The key differentiator of trackers is that they are run at regular intervals over time, perhaps daily, weekly, monthly, quarterly, or annually. Here are a few key criteria to keep in mind as you decide.


How active is your brand? Think about whether you launch new campaigns, run webinars, make major announcements, or change product features daily, weekly, monthly or less often. If people see new and different activity from you on a regular basis, you may need to conduct your trackers more regularly so you can identify which items have hit or missed the mark.


How active is your category? If your category experiences rapid innovation, news headlines that constantly change, or new competitors constantly entering the arena, you might need to track more frequently. Consumer opinions could quickly and easily change based on any of those and you’ll need to identify and act on external risks to your brand as quickly as possible.


What is your measurement tool? Social media data, sales data, online purchase ratings, and consumer generated reviews are easily tracked on a daily basis, even an hourly basis. In rare cases, questionnaires have been used for daily tracking but they’re more often used for weekly or less frequent tracking. If your metrics are best measured by social media data, you could choose more frequent intervals as long as they don’t eat up someone’s time unnecessarily, (e.g., manual preparation or analysis).


Remember, just because you can track and measure something more often doesn’t mean you should. Track your metrics as often as is necessary to be proactive and reactive in your category environment.


How to Conduct a Brand Tracker Study


  1. Identify your brand purpose, mission, and vision. In order to know what to track, you first need to know what your brand stands for, and what you want your consumers to think, feel, and do about your brand. With this information, you can ensure your data collection tool addresses key concepts and can generate relevant results.


  1. Identify your target audience. It’s easy to think only about your own customers but that will generate an incomplete picture of your brand. Also consider people who might eventually purchase your product whether for themselves or for a friend or family member. With this information in hand, you can ensure the questions you write will make sense to both users of the product and buyers of the product.


  1. Identify the key brands. You might be tempted to include every product your company makes in your tracker but that will lead to an unfocused and disorganized questionnaire that people can’t answer accurately. Focus on one brand in one category. Then, identify the key competitors of that brand, including the brands you admire, are jealous of, and worried about. This will give you a baseline metric to understand whether you’re over or under-performing in your category, and to identify which brands you’re taking share from – or which brands are taking share from you!


  1. Identify the key metrics. As previously described, there are literally hundreds of potential metrics to choose from. Identify the ones that are most relevant in identifying the success and failure of your brand. Don’t let your ego or chasing KPIs prevent you from seeing the negatives. Without those, you won’t know what needs to be fixed in order to achieve huge growth.


  1. Identify what success looks like. You need a clear definition of success to prevent confused interpretations of the data and to keep yourself honest. For struggling brands, status quo might be success. For huge brands, 3% growth might be success. But, fresh brands might only find success with growth higher than 35%. Decide on the success requirement for each key metric prior to data collection.


  1. Identify the sample size. Once you know what your metrics and your success measures are, calculate the sample size required to accommodate them. For example, if success for you is an increase in purchase rates from 5% to 25%, you might only need a sample size of 100. But, if success is an increase from 5% to 8%, you’ll need a much larger sample size to be able to reliably detect it, perhaps up to 1000.


  1. E2E Research Decorative imageBuild the tool. Now that you know what your metrics are, build the tool to measure them. That could be a questionnaire, social media listening data, click stream data, or sales data. Using a combination of two or more methods will allow you to cross-validate your findings so your conclusions and recommendations are more trustworthy. As you build the tool, make sure to measure both positive and negative aspects of the brand. Chasing positive KPIs rather than understanding your brand means you won’t be able to prevent or fix problems and the brand will suffer in the longer term. And, take the time to create an interesting tool that will help participants remain engaged and pay close attention.


  1. Collect data. Take care to not add bias to your data by insisting on extremely short field times. Collecting data over 2 weeks ensures that shift workers, weekend and evening workers, technology avoiders, and people traveling all have the opportunity to participate. Without these people, your data could be biased towards people who are at their keyboards at the moment you launch the survey, a small minority of people.


  1. E2E Research Decorative imageAnalyze the results. When brands take small or few actions throughout the year, tracker results can be stable and minimally useful. As a result, in addition to basic frequencies and averages for the total sample and subsamples, use dashboards to search for unexpected or unusual results. Those serendipitous results could be random chance never to be seen again, but they could also be an amazing discovery. Be prepared to conduct ad hoc research to confirm or deny those discoveries.


  1. Act on the results. Based on your data analysis, change your branding, messaging, advertising, marketing, or business processes to improve negative aspects and leverage positive aspects. Remember that consumers need adequate time to notice, remember, and truly internalize the messages you’re sharing so don’t worry if you don’t see the numbers you hoped for after the first wave. And, if you notice issues or flaws in the data collection tool, improve those as well. Remember, you CAN change a tracker.


  1. Repeat. You won’t need to completely repeat each stage each time, but you should at least review and consider whether any stages need to be updated or improved.


What’s Next?

Are you ready to take proactive steps to understand your brand and make strategic changes to improve its chances of success? Email your project specifications to our research experts using Projects at E2Eresearch dot com. We’d love to help you turn your enigmas into enlightenment!


Learn more from our case studies


Learn more from our other blog posts
How Two Canadian Store Brands Became Beloved National Brands
By E2E Research | August 1, 2022

Decorative image
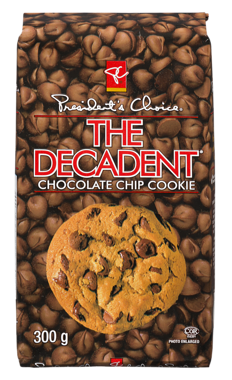
The first thing I think of when I hear the name “President’s Choice” is chocolate chip cookies. Thirty-five years ago, when this store brand first appeared on Canadian Loblaw’s shelves, it packed more chocolate chips into their cookies than any other brand. Even more than the name brand cookies. (Even more than my mom’s home baked cookies.) It was the only “brand” of cookie that any Canadian kid wanted.


The President’s Choice brand was the brain child of Dave Nichol, the president of Loblaws Supermarkets, a premium supermarket chain. His strategy was to increase the company’s options by creating top quality products at better prices than the leading brands, products that couldn’t be purchased anywhere else but Loblaw’s. The plan wasn’t to create good products. It was to create great products. The President’s Choice brand, Dave’s choice, launched. The no name brand was launched around the same time, but we’ll get to that story in a minute.


The PC brand started with ground coffee. As planned, they made a coffee product that was better than the leading brands. Along with its competitive pricing, it quickly became a top selling item.


The beloved chocolate chip cookies followed soon after and it didn’t take long for them to became the best selling cookie in all of Canada. When the competition was known for having just a few “chocolatey” chips (i.e., not real chocolate) in each cookie, a cookie made with real chocolate chips that comprised nearly half of the cookie was a huge success.


These two amazing products created a trustworthy foundation for people to want to test out all the other President’s Choice products.


The PC marketing strategy was also very focused. Unlike traditional store flyers/circulars which incorporated a multitude of competing brands, the PC team created a print magazine to showcase only their products. Now in digital form, the magazine boasted large tantalizing photos, tasty recipes, household tips, and details about upcoming new products. They also ran many campaigns featuring Dave Nichols as the stereotypical Canadian spokesperson – quiet, kind, and helpful.


By 1990, the PC product line had increased to 500 brands including environmentally friendly products, low-fat products, organics, banking, and household items, often innovating in categories before their competitors. Their magazine was read by nearly 60% of Ontario households. PC was 20% of Loblaw’s revenue and generated $1.5 billion in annual sales.


In the early 90s, PC products had expanded outside of Canada to the USA. Australia, Hong Kong, UK, Sweden, and South Africa.


In 1993, Dave Nichol left the Loblaws team, but when Galen Weston joined as Chair of Loblaws in 2006, he resumed the spokesperson role, also as a stereotypical quiet, kind Canadian. The brand continued to grow and in 2014, PC was named one of the top 10 most influential brands in Canada. In 2016, Strategy chose PC as the Brand of the Year.

.

Today, there are more than 3500 PC products on the shelves at Loblaws and other affiliated stores. Canadians no longer view PC products as a store brand, and PC chocolate chip cookies are just as loved as they always were.


Decorative image
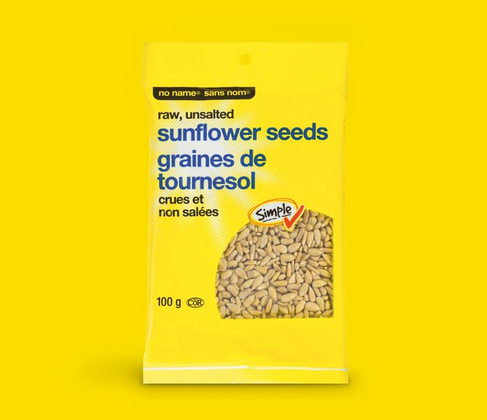
And what about No Name products?


Well, no name products have also been around a long time. Since 1978. It’s always been the value priced brand in the conspicuous yellow package with minimal messaging that frugal shoppers like myself fill their cart with.


For many years, no name was just another low-priced option on the shelf. They did only a little bit of marketing. But, in the last 5 to 10 years, people have become much more open to discount shopping. The stigma of buying the store brand was going away. It was time for the no name brand to really shine.


In 2019, the brand embraced the minimalism normally associated with store brands and actioned it with a much loved marketing campaign. It included a bright yellow website, a deadpan funny Twitter account, and cheeky minimalist messaging.


They even created “merch.”  Confusing to outsiders and humorous to Canadians, we’ve been able to buy bright yellow beach towels that say beach towel and bright yellow t-shirts that say t-shirt. Three years later, the no name marketing campaign continues as a huge success.


.

If your brand needs some inspiration on how to grow, look no further than the product and marketing strategies of these two Canadian brands. Be singular in your product goals and take risks with your marketing strategies. Bringing real people and humour to people’s lives can make all the difference.

.

.

Learn more from our other blog posts


Developing competitively superior hot meal formulations | A fast food CLT sensory test
By E2E Research | July 5, 2022

Research Objective

  • Our quick service partner was expanding to additional high growth markets and needed to understand consumer perceptions of several food categories and formulations against a key competitive brand.
  • They needed a trustworthy partner with extensive global experience who could manage all aspects of the project including professional consulting, recruitment, field management, and analysis and reporting.


Scope & Methodology

  • More than 1000 participants were pre-recruited reflecting GenPop category non-rejectors. Quotas were placed on age and gender.
  • Over a period of 6 days, a sequential monadic preference taste test compared a set of ingredient formulations across several product categories. Product brands were concealed.
  • Using tablets, participants rated each product across a range of sensory metrics, including flavor, texture, temperature, level of cooking, color, and many other features.


Value Delivered

  • Using JAR analysis, penalty analysis, and a priori action standards, our partner discovered which formulations were preferred for each product category.
  • They also learned which primary and secondary features of each formulation and product needed to be retooled to further increase their odds of success.


What is brand equity: Importance, benefits, tips, and examples to build a more successful brand
By E2E Research | March 7, 2022

What is brand equity?

Think about a brand you absolutely love – a store you can never wait to go to, a product that makes you grin just thinking about it.


Now think about brands you absolutely hate – a product or company that makes millions of people roll their eyes and groan with disgust.


That’s brand equity! Or lack thereof.


Brand equity is a complex construct. At its core, it’s a subjective perception of a brand’s value, quality, performance, and personal relevance. It incorporates consumer perceptions related to the product and its packaging, presentation, mission, vision, and values.


An easy way to think about brand equity is that it’s the difference in price and preference between an unbranded (or store brand) product and a branded product. Even though they’re the exact same thing – soda, butter, oil, beef, corn, eggs, many people will choose the brand name version because of the higher value they perceive it to have.


It can take a long time to build brand equity but one wrong move and it can be destroyed in seconds.


Why is brand equity important?

There are many benefits to building brand equity, and collectively their benefits are massive.

Decorative image store brand and starbucks coffee cups

  • Premium pricing: One of the key benefits of high brand equity is the ability to charge premium pricing. When people believe in and love a brand, they will pay more for it. Coffee is coffee but people will pay more for coffee that comes in a cup with a Starbucks brand on it, a name they know and trust. That higher price leads to higher profits which, of course, leads to greater financial success.


  • Low price elasticity: When people value a brand, they are more likely to purchase that brand even in competitive situations. High equity brands don’t have to worry as much that competitive brands will ‘steal’ their customers with a great BOGO or intriguing offer. And, they don’t have to spend as much time and money creating offers to convince competitive buyers to try their products.


  • Customer lifetime value: When brands create high equity, their customers are more loyal to the brand and purchase more of their products over a longer time period. Even better, those loyal customers are more likely to try new products created by the brand, whether in the same or other categories. The trust has already been built and customers don’t have to overcome the fear of trying a new brand. They simply need to determine whether the new product meets their needs.


  • Market resilience: Products with high brand equity are more likely to endure during uncertain circumstances. When environmental, social, and political events necessitate a change in purchase and behavioural patterns, people will still try to retain consistency in their lives. High equity brands offer consistency, trust, and reliability when consumers need it most.


  • Market power: As a high equity brand that people trust and desire, you have increased opportunities to attract and demand the best. Your demonstrated power in the marketplace means you can attract the best employees, the best suppliers, the best investors, and also negotiate the best prices and rates.


How to Build Brand Equity?

Brand equity can take a long time to build. However, there are a number of strategies and tactics that companies can leverage to get there. The key is playing the long game.

Decorative image customer journey mapping

  • Understand consumer needs and values: By understanding what consumers truly want and need, you can ensure your products and services are relevant to them. Take advantage of quantitative questionnaires and qualitative focus groups and interviews to understand customer journeys, gaps and pain points, customer personas, and customer segments. Dig deep to uncover their physical, emotional, social, psychological, environmental, and spiritual needs so that you can discover what might convert them from casual tryers to long-term, loyal advocates.


  • Understand product differentiators: Not only do you need to understand your buyers and prospects, you need to understand what attributes elevate your products and services ahead of your competitors. Primary and secondary research will help you understand the competitive marketplace, market positioning, innovation opportunities, or opportunities for product optimization.


  • Fine-tune your messaging: Once you understand your consumers and your products, ensure your messaging is in alignment. Primary research will help you ensure your product messaging and campaign research focus on messages that resonate with your customers and address their key values, unmet needs, values, and pain points.


  • Deliver on promises: It may sound easy, but delivering on your brand promise is tough. Most brands have many disparate channels, all of which need to present your brand and your products in an unrelentingly consistent way. Whether in-store, on the phone, or online, your brand’s character, values, and vision must drive every customer interaction and business decision in a consistent way.


  • Foster loyalty: It’s important to foster loyalty among your existing customers. Pay attention to your most loyal customers and create opportunities to reward and encourage them. Give them reasons to continue loving your brand whether that’s special offers or enhanced customer service.


 brand logos with no brand names

  • Drive awareness: If you’ve been paying attention to the animated image to the right, you’ve probably been able to name the brand behind every single logo. Despite the fact that not a single brand name is shown. This is brand equity. And this is the level of brand awareness that every brand ultimately strives for. When your customers and prospects recognize your brand colors and shapes, it’s far easier for them to find and choose your brand off the shelf, virtual or physical. Run carefully targeted advertising campaigns on a variety of relevant channels that focus on your benefits, stories, and value to help consumers learn, and connect your messages and your branding. Try a variety of relevant tactics such as influencer marketing, celebrity endorsements, or event marketing.


  • Create positive customer relationships: Customer experiences are no longer confined to the physical store. Brands need to create positive experience across every physical and digital touchpoint including their own online stores and social media channels like Twitter, Instagram, and TikTok. Pay attention and respond quickly to customers sharing their opinions on review websites like Amazon, Foursquare, and Yelp.


Positive brand equity vs. negative brand equity

When people pay more for a brand even when there are equivalent yet lower priced brands available, that’s positive brand equity.


But, when people avoid or ignore a brand, even when it’s pricing is very competitive, that’s negative brand equity. For some companies, negative brand equity can destroy a brand such that consumers quickly forget it ever existed. For others, the negative equity is fleeting and at least somewhat recoverable.


Decorative image amazon brand equityAmazon: Since starting up as a book seller, Amazon’s focused effort on meeting customer needs has resulted in amazing brand equity. Because of their unquestioning return policies, unending selection, and ability to get product in hand in mere hours, customers are fiercely loyal. That’s positive brand equity.


Decorative image apple brand equityApple: Apple is another great example of a company with positive brand equity. Their customers are massively loyal. Even though Apple products are known to be pricey, customers line up every time a new product is released even if their existing product still works great. Customers trust the quality, reliability, and functionality of Apple products and remain loyal customers for years. Why? Because Apple focuses on creating innovative, self-explanatory products that meet customer needs every single time.


Decorative image chipotle brand equityChipotle: In 2015, Chipotle experienced a food poisoning crisis which led to a $25 million federal fine. After years of positive growth, that crisis caused the brand value to decline sharply. It was several years before they managed to regain consumer trust, and recover and grow their brand value. This is a great example of positive brand equity turned negative and then reverting to positive again.


Decorative image mcdonalds brand equityMcDonald’s: Though McDonald’s has been the #1 burger chain for years, they struggle with ongoing negative brand equity. Customers and consumers have complained about unhealthy food options for decades, and that perception seems relenting no matter how McDonald’s tries to head it off.


Decorative image starbucks brand equityStarbucks: Want some high-priced coffee? Well, Starbucks customers are willing to pay a premium because they love the high-quality product and they love the top-notch customer experience – even when their name is accidentally (deliberately?) misspelled on their cup. Whether you’re a customer or not, everyone immediately recognizes the logo of this high equity brand.


Decorative image toms shoes brand equityToms: People love the Toms shoe company. Why? Not only do they make a great shoe, they donate a pair of shoes with every purchase. This human centered value makes customers feel good about their purchases, and keeps them coming back again and again to support a company that matches their own values.


How to Measure Brand Equity

Because brand equity is so multi-faceted, measuring it isn’t simple nor templated. It’s important to incorporate a range of relevant quantitative and qualitative metrics, as well as financial and market assessments to gain a holistic view of brand equity.


Quantitative metrics: As part of a quantitative questionnaires, there is a wide range of questions that can be posed to consumers and customers to better understand your brand equity. As you’ll seen in the images below, these kinds of questions can be posed not simply as traditional radio buttons and checkboxes, but also as interactive, engaging image style questions.

  • Brand awareness: What three brands come to mind first when you think of washing detergent? What other brands have you heard of?
  • Brand perception: Which of the following words reflect how you feel about this brand of washing detergent?
  • Consideration: On a scale from 1 to 10, how likely are you to buy the following brands of washing detergent the next time you go shopping?
  • Loyalty: On a scale from 1 to 10, how likely are you to recommend the following brands of washing detergent to your friends or family?
  • Loyalty: How often do you buy the following brands of washing detergent?
  • Trial: If this brand of washing detergent were to release a fabric softener, how likely are you to try it?
  • Customer experience: On a scale from 1 to 10, what is your opinion about the customer service you received from our online chatbot or our social media or telephone representative?

E2E Engame question animation E2E Engame question animation

.

.

Qualitative metrics: Of course, there is far more to measuring brand equity than focusing on quantitative questions. Focus groups, interviews, and other qualitative tools like online communities are also excellent ways to measure brand equity.  By combining qual and quant methods, you can gain a more holistic view of this subjective construct. Here is a sample of some types of questions and tasks to incorporate in qualitative research, again with a couple examples of how more qualitative questions can be incorporated into traditional online measurements.

  • What is your opinion of this logo and imagery?
  • Describe 3 things you love about this brand and 3 things you hate about this brand.
  • Why do you buy the following brands of washing detergent?
  • Why would you choose one brand of washing detergent over another?
  • Which of the following images reflect how you feel about this brand of washing detergent? Tell me why.
  • If this brand of washing detergent was a person, how would you describe it?

E2E Engame question animation E2E Engame question animation


Behavioral/transactional metrics: Financial and company metrics are also extremely important for understanding brand equity.

  • Company metrics: What is the value of the company, and is it increasing?
  • Brand metrics: What is the market share of the brand, and is it increasing? What is the profit of the brand, and is it increasing? What is the price difference compared to generic brands, and is it increasing? What is the purchase volume and frequency for the brand, and is it increasing?
  • Employee metrics: What is the cost of employee acquisition, and is it decreasing? What is the average tenure of an employee, and is it increasing? How many applications per open position are received, and is it increasing?
  • Customer metrics: What is the cost of customer acquisition, and is it decreasing? What is the average tenure of a customer, and is it increasing? How many customer complaints are receiving during a specific time frame, and is it decreasing?


What’s Next?

Are you ready to discover top quality insights about your brand and grow your brand equity? Email your project specifications to our research experts using Projects at E2Eresearch dot com. We’d love to help you better understand your buyers and your brand to help you turn your enigmas into enlightenment!


Learn more from our case studies


Books and Videos You Might Like


How to Leverage TikTok as a Consumer and Customer Insights Tool
By E2E Research | October 28, 2021

Confession time.


I’m addicted to TikTok.


What is TikTok?

List of digital things that happen in a minute
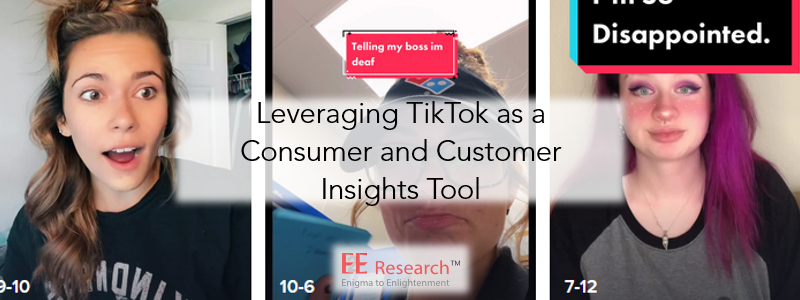
TikTok is used by more than 1 billion people each month and, including me, they watch more than 167 million videos every minute. Wow!


If you haven’t used TikTok before, I’ll give you a quick explanation. Anyone, not just the tweens and teens, can set up an account to watch or post videos of up to 1 or 3 minutes.


“Creators” are people who make videos of themselves talking, walking, dancing, or of the world around them. Creators can be regular people with 3 followers, influencers with millions of followers, small business owners, or companies with large social media teams.


Personally, I’m a lurker. I don’t make videos (as you can see on my personal TikTok account) but I have a bunch of favourite accounts and favourite topics that I love to watch.


The topics are literally endless – whatever strikes your fancy, whether that’s cats and cheese or deep social, cultural, and political issues.


TikTok uses an analytical algorithm to decide which videos it presents to you. If you swipe past a video really fast, they’ll show you fewer of those kinds of videos. If you watch, like, or comment on a video, they’ll show you more of those kinds of videos.


The algorithm works FAST so if you ‘like’ a puppy video, you’ll be offered several more of those almost immediately. What it means is that you need to swipe past videos you dislike really fast or you’ll just get more of them – and that won’t make you happy.


Why do I like TikTok?

Even though I live in a city where more than 50% of residents belong to a visible minority community, my neighbourhood, my grocery store, and my social circle are not very diverse. I don’t see a lot of people who don’t look like me. And with the panorama (as I prefer to call it), I’ve been visiting diverse communities in my city far less often than usual.


This is why I love TikTok. I’ve found a Tok for so many communities different from my own. DisabledTok, DeafTok, AutismTok, IndigenousTok…. but I haven’t yet found “ResearchTok.”


Of course, ResearchTok is actually everywhere. You just have to listen carefully.


TikTok for insights

Naturally, TikTok can be used as any other social media channel is used for social listening purposes. Many videos come with automated or manual captions, as well as audio that can be transcribed and coded.If you want to collect opinions about brands, buyers, and businesses, you’ll get a first hand look at those opinions right here.


But TikTok is an invaluable research tool for people who design research, whether that’s quantitative questionnaires, qualitative groups and interviews, or something else. Here’s why.


People with disabilities: TikTok is where I get to actually see and listen to people who are disabled navigate their world. I see and hear first-hand the motivators and barriers they experience as they drive, shop, and consume in their everyday lives.


I see the struggles they face as cars block the sidewalks and ramps making it impossible for them to visit their favorite stores. I see how stores fail to accommodate their needs by not providing ramps or placing self-serve counters out of sight and out of reach. I watch how packages can’t be held or opened or poured because the package designers didn’t account for their user base.


I get a whole new and improved perspective on the types of issues I need to account for when I write questions about accessing and navigating stores as well as choosing and using product packages.


People of different ethnicities: Though I’m sure I’ve experienced some biases because of my specific demographic characteristics, TikTok is where I see the huge biases and aggressions experienced by people who are marginalized every single day, everywhere they go.


I see how hand driers don’t recognize darker skin, how brands frame people who are marginalized as victims, and how code switching means some people can’t be their authentic selves at work, at school, or while shopping.


It reminds me that it’s so important to ensure the research I conduct accounts for and respects people of all ethnicities. It reminds me that sticking to strict census balancing isn’t sufficient – I need to boost and weight sample for Black and Indigenous people so I can truly listen to and understand everyone.


People of different sexualities: Ever wonder what all the letters in LGTBGQIA+ stand for? TikTok has your back. People of all genders and sexualities are happy and keen to share their perspectives about the world around them and how they’re treated in it.


Listen first hand to how binary sex and gender options trivialize, diminish, and ignore their life experiences, and how relieved and heard they feel when they’re able to accurately describe themselves.


Sure, I might have decades of hard coded memory telling me that gender is binary, but I need to cancel that narrative and recognize that gender is a construct not a fact. I need to make sure demographic questions are accurate, respectful, and all-encompassing.


What’s the impact of TikTok on research?

As a relatively privileged person, TikTok has further opened my world to the rainbow of people who exist in it. My personal experiences may be common but there are millions, billions of people whose experiences I could have never imagined without the help of TikTok.


My questionnaires are better written. Not only am I far more careful and knowledgeable about how I write demographic questions, I’m more careful about how I write questions about brands, retailers, and product usage. I’ve always used my own experiences to write those questions, but now I am better able to consider a much broader range of experiences.


If you’re interested, here are a few of my favourite accounts. These folks are well-informed, educational, funny, and eager to share their personal experiences so that people like me can do better. Learn lots!


What’s Next?

Are you ready to discover top quality insights about your buyers, brands, and business? Email your project specifications to our research experts using Projects at E2Eresearch dot com. We’d love to help you turn your enigmas into enlightenment!


Learn more from our case studies


Learn more from our other blog posts

The Who, What, Where, When, Why, and How of Online Insight Communities
By E2E Research | October 21, 2021

What is an insight community?

In the market and consumer research industry, online communities are often called Bulletin Boards, Insight Communities, Market Research Online Communities, or MROCs. Though they can incorporate quantitative activities like questionnaires, insight communities are mainly considered a qualitative research technique.


Whether it’s a group of 5 people who chat with each other over several days or thousands of people grouped into segments engaging with each other over several months, insight communities exist within a dedicated digital space to allow people to share their thoughts, feelings, and behaviors about a common topic or goal. These digital spaces normally support the community with features like polls, surveys, image mark-ups, chat rooms, bulletin boards, video/image sharing, and more.

Cartoon from XKCD: Social media network communities
Insight communities aren’t just really large or long focus groups. Unlike focus groups that are often conducted in-person over a couple of hours with 4 to 10 people, communities are nearly always conducted asynchronously and virtually over several days, and with far more participants. (In the research world, asynchronous means that the researcher and the participants aren’t necessarily using the tools at the same time. A participant might share their comments in the middle of the night, and the researcher might respond to them the next day.)


Insight communities are generally NOT open to anyone with a pulse and an email address. While E2E Research has a Facebook page and a community that likes to read our posts, that’s not the kind of community we’re talking about. Using Facebook, Instagram, and TikTok to listen to consumer and customer needs and opinions, and elicit feedback from groups or individuals doesn’t make a social media network an insight community.


There are no written in stone rules about how communities must be run. However, here are answers to some common questions that will help you think through the process more completely and figure out whether a community could be a wise choice to meet your specific research needs.


What is the purpose of research communities?

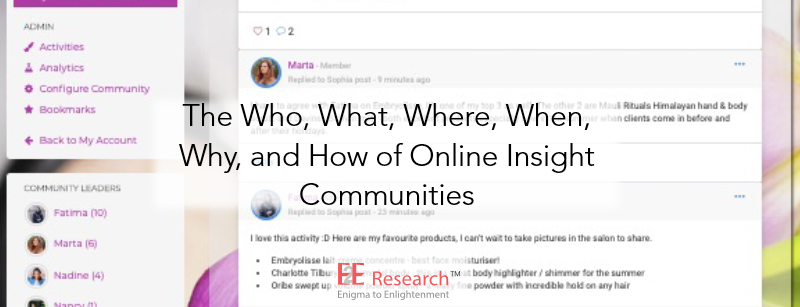
Like any market or consumer research project that intends to generalize valid and reliable findings to a broader population, every insight community needs clear planning, goals, and research objectives that lead to specific outcomes. “Signing up” or “finding lots of members” are not acceptable goals, nor is “getting lots of comments every day.”


For insight communities, clear goals could include working to:


  • Understand how the psychological value people place in your brand changes over time
  • Learn why some brands become stagnant over time
  • Learn how people interpret and act on advertising campaigns and communications from specific brands or in specific categories
  • Track detailed perceptions of brands’ marketing tactics over time
  • See how the use of a new product evolves over time
  • Gain insight into how world events or life-stages affect product usage throughout the year
  • Understand how local retailers design their outlets throughout the year
  • Gather ideas for new products and gain feedback on a variety of concepts and prototypes


Why are asynchronous communities valued over synchronous tools?

From focus groups to questionnaires, researchers have many data collection tools to choose from, each with their own benefits. However, insight communities that allow people to log in and out at their own convenience have many benefits for participants. They:


  • Give shy or anxious people an opportunity to become familiar and comfortable with the research process before having to share their opinions publicly
  • Allow people to share opinions as they arise rather than feeling pressured to perform on-demand
  • Give people a chance to rethink and change their opinions over time
  • Allow people to remain anonymous to the group and share their truths while still remaining known to the researcher
  • Are not disrupted when someone has to join late or stop participating early
  • Allow people who work rotating, weekend, or night shifts to participate
  • Are more accessible to marginalized people who may only have internet access intermittently or at third party locations


How are insight communities moderated?

Communities aren’t a quick alternative to groups or interviews. Even if a community is planned to run over just a couple of days, it requires extensive pre-planning, moderation during those days, and lots of post-project analysis and identification of next steps. Without planning for this investment of time and resources, everyone’s efforts will be lost.


Once participants have been recruited and understand the guidelines they need to follow, moderators are still essential to:


  • Engage with every participant daily so they know their contribution is desired and valuable
  • Introduce daily and weekly tasks and assignments
  • Ensure everyone participates in every task and meets all the task requirements
  • Prompt and probe participants to share as much detail and insight as possible
  • Identify and convert emerging issues into new goals, tasks, and outcomes
  • Keep discussions focused on the important topics
  • Ensure participants remain respectful to each other


Who participates in insight communities?

Most insight communities are private and more secure than public communities.  A dedicated community recruiter carefully seeks out participants who have the ideal characteristics and offers them appropriate incentives to complete the agreed upon tasks.


This careful recruitment ensures that generalizations from participants are relevant to the issue, category, or brand, and will lead to valid and reliable insights and outcomes.


Here is one example of a local government body recruiting for an insight community to better understand the needs of their constituents.


In addition to having digital, internet, and email capabilities, participants may be required to:

  • Have specific demographic details, e.g., a child under 2 years of age, live in a rural area
  • Own, use, or buy a specific brand or product category, e.g., use body lotion, buy Froot Loops
  • Demonstrate specific behaviors, e.g., run at least twice per week, attend a music festival in the last year
  • Hold specific opinions, e.g., strong feelings about the environment, clear ideas about gender roles
  • Have a minimum level of written skills in a specific language in order to accurately express their opinions


What are insight community members required to do?

Insight communities also have clear rules for participants who wish to join and remain part of the community. They may include requirements to:


  • Spend a minimum number of minutes in the community each day
  • Answer at least one moderated question in detail every day
  • Comment on other people’s posts at least once per day
  • Participate in at least one poll or survey each week
  • Share at least one image or video each week
  • Be respectful of others’ opinions and refrain from using profanity


How do insight communities benefit participants?

Communities don’t just benefit brand managers, marketers, and researchers. There’s also a lot of good for the participants too. For instance, participants:


  • Feel pride in knowing their contributions will help other people through the development of better products and services
  • Feel a sense of accomplishment for their contributions
  • Discover new products that might enhance their lives
  • Discover unknown features of the products they already use
  • Learn how to use their favorite products more effectively
  • Learn innovative, alternative uses for their favorite products
  • Learn how their peers have solved problems they might encounter in the future


How do communities speed up the path to insights?

Insight communities can take many forms. Sometimes, they’re just a few days long and focus on one or two specific products. Other times, they can last several months and focus on broad categories.


Longer-term communities offer researchers the capability to ask consumers questions about anything at any time. As such, when an urgent research question arises, there is no need to spend a week or two recruiting a selection of people – those people are always at the ready. Further, such communities run by companies with multiple brands may leverage those communities to learn about different brands and categories throughout the year.


In other cases, when unexpected issues arise, perhaps because of societal issues or emergencies, a great community moderator can have new questions and tasks lined up for their members in mere hours and have results flowing in by the end of the day. This speed can ensure that small issues are quickly resolved rather than letting them balloon into huge issues that destroy a brand.


How do insight communities reduce costs?

Online communities help lower costs in different ways. First, longer-term communities can take the place of multiple ad-hoc projects. This eliminates the need to recruit participants multiple times. Further, participants are already ‘trained’ in how research works and need far less time and guidance to navigate the software and complete the tasks.


Second, insight communities have a benefit of allowing marketers and brand managers to understand reoccurring issues customers are having. This early information gives them a chance to understand and fix small problems before they become large problems for their customers outside the community.


What’s Next?

As with any research technique, there are a lot of intricacies to learn and implement. Fortunately, a good partner will make the process easier for you. If you’re ready to leverage an insight community to discover top quality insights about your buyers, brands, and business, email your project specifications to our research experts using Projects at E2Eresearch dot com. We’d love to help you turn your enigmas into enlightenment!


.


 Learn more from our case studies

.

Great Reads About Qualitative Research

Most research methodology books cover online communities as a chapter in more comprehensive books about qualitative research. Here are a few of our favorites.


Conferences focused on Qualitative Research


8 (Not-So) Secret Strategies for Great Market and Consumer Research
By E2E Research | August 25, 2021

The secret to successful research may not be a secret but in the hustle and bustle of work, we often forget one or more of them. If that describes your day today, then consider this your quick and friendly reminder!


#1 Don’t sell: solve problems.

As researchers, our job isn’t to sell questionnaire design, scripting, data analysis, report writing, and dashboards. Those may in fact be the specific services we offer but our real job is help our partners discover practical solutions to their business problems – Why isn’t this SKU selling, what new product do consumers want, who are my customers, how can I upsell to a target audience, how can I complete more projects when half my team is on holidays, how can I help a client when I don’t have all the services they need?


Our job is to thoroughly understand the business and research problems, and then translate them into appropriate solutions. Whether it’s concept studies, customer segmentation, journey mapping, market forecasting, or providing professional services, if we can’t translate a need into a custom solution, we’ve not done our job.


#2 Know your audience

A lot of market research starts by truly understanding a specific audience. Who are they – what are their hobbies, where do they live, where do they work, what does their family look like? It’s really easy to calculate a median age and the percentage of customers who are female but the last few years have taught us a lot about intersectionality – it’s not just “women,” it’s “disabled Black women.” In the research world, we understand this as customer segments or personas.


After conducting a well-designed survey, focus group, personal interviews, social listening, or analytics, you’ll have the necessary data to run a reliable segmentation and identify 3 to 5 distinct target groups of people within your ideal audience. For example, a couple of common ones are Primary Grocery Shoppers and Moms of Infants.


Once the data has spoken, you can then build a unique buyer persona, a fictional character, for each target group to clearly outline each one’s unique characteristics. This will make developing a set of products, prices, messaging, and marketing that genuinely resonates with each one much easier.


#3 Map your marketing

Researchers spend a lot of time mapping journeys – shopper journeys, patient journeys, student journeys, employee journeys. Building products that people want to use and buy means understanding the wants, needs, and challenges customers experience at every stage of the journey. You might discover that the most problematic stage, in fact, is not the most problematic stage.


Build a plan to understand every stage of the journey from end to end. As eloquently shared by Biz Davis from Abacus Agency, you need to understand whether your brand is lacking in awareness, interest, consideration, purchase, or advocacy, and whether consumers want to be entertained, inspired, educated, convinced, or delighted.


#4 Think like you search

If you’ve written a questionnaire before, you know how important this tip is. Sure, you could write a questionnaire as if you were Charles Dickens showing off his stunning, grammatically correct 200-word sentences with multiple, embedded clauses.


Or.


You could search on TikTok and Twitter and find out how people really talk. Use phrases regular people use. Use words everyone understands even if there’s a technically more precise word. Write questions and answers the same way people search and you’ll end up with a questionnaire that people want to answer!


#5 Promote your content

In the marketing world, this means thinking about native ads, social sharing, and cross-channel marketing. But for researchers, it means sharing your research across the company – from researcher to brand manager to innovation team to development team to marketer.


When everyone in the company is familiar with the results of your research, they can each do their part to amplify the outcome of the insight.


#6 Tell a great story

How do you get colleagues to share your research? Easy! Well, it’s not that easy. Storytelling is a necessary skill that will carry your research results throughout the company. Let people know what is exciting about the insights, how they could be used to reach consumers in unexpected ways, how they could personally benefit from understanding the results.


And sure, though the bulk of the research will be educational, informative, and standard, be sure to incorporate just a small bit of fun along the way.


#7 Become an authority

Don’t rest on the laurels of the research you did last year. That’s old news now. The theory may be correct but times and technology have changed. Follow up last year’s study with one that builds on what you’ve learned from your colleagues, seen among your competitors, and witnessed in related industries.


Show your colleagues what your brand could become if everyone worked together to leverage new, innovative research methods, techniques, and skills. Become the expert at your company who constantly pushes everyone forward towards building a better product and a better company. Get that seat at the table.


#8 Start small to grow big

You could build and execute a 5-year research plan.


Or, you could start small with a single project that gives you a solid overview of one product or target audience. Inhale it, memorize it, internalize it.


Then build the five-year plan. Because at this point, you’ve seen all the strengths and weaknesses among a specific product, how your colleagues work together, how your company systems work, and what’s happening in your industry. You have perspective now.


Now you get it. Now you can think really big.


My inspiration for this post?

I watched a webinar given by Biz Davis from Abacus Agency in Toronto in which he shared a bunch of his secrets for building an effective marketing strategy. The webinar will be posted on their website very soon so do go have a peek.


While watching, all I could think was how relevant his secrets were, in particular, for market and consumer researchers. The headers are his words, and I riffed on the ideas to bring you the research tips.


Are you ready to plan a great market or consumer research project from End to End? Email your project specifications to our research experts using Projects at E2Eresearch dot com.


Learn more from our other blog posts

Mapping a Patient Funnel to Mitigate Cancer Treatment Barriers | A Cancer Patient Case Study
By E2E Research | April 19, 2021

Research Objective

  • The healthcare client needed to map the patient journey from symptom to diagnosis, treatment, and recovery in order to create patient segments that could be used to leverage market opportunities that drive and influence treatment decisions.
  • They needed to identify factors influencing brand association and satisfaction, promoting brand prescribing, and brand switching


Scope & Methodology

  • Data points included
    • Treatments received by newly diagnosed stage III patients
    • Key unmet needs for unresectable cancer patients who have completed CRT
    • Key patient and administrative reasons unresectable patients have not completed Concurrent & Sequential CRT treatment


Value Delivered

  • The client was able to identify the most likely patient segments who would benefit from a treatment.
  • Emotional and physical barriers leading to unmet needs were identified and redirected to leverage new opportunities for prescribing practices.


Check out other healthcare case studies

Benchmarking Brand Awareness and Competitive Brand Space | A Consumer Food Survey Case Study
By E2E Research | March 5, 2021

Research Objective

  • The client needed to identify parameters of brand strength and understand how the brand was perceived in relation to its competition.


Scope & Methodology

  • A survey was launched to measure brand awareness within the category and to capture the importance of key attributes for the category.
  • Analyses included assessing the strength and importance of key drivers, and overall satisfaction. These assessments were conducted at both the global and country levels.
  • The data showed that while the brand enjoyed the highest awareness in the category, it was only the third highest in terms of purchase consideration. The data also showed that the brand competed most closely with two specific brands on several key attributes.


Value Delivered

  • A set of key performance indicators, including brand awareness, perceptions, and importance, was benchmarked for a set of brands in the category.
  • The brand was able to make targeted improvements to the product and understand their impact on brand perceptions in relation to the competition.


Check out other food case studies